
Key Highlights
- Dogecoin price managed to stay above 60.0 Satoshis where it found support on a number of occasions.
- There is a bullish trend line formed on the hourly chart, which is acting as a barrier for sellers.
- A few bearish signs are noted, which are providing mixed signals in the near term.
Dogecoin price might trade higher moving ahead, as sellers failed to take it lower which escalates the chances of gain.
What’s next?
There was an upside reaction recently in the Dogecoin price, as it traded above 74.0 Satoshis. However, buyers failed to maintain strength, which resulted in a down-move. The price fell back towards the last swing low of 60.0 Satoshis, which acted as a barrier for sellers. The stated support area stalled the downside on many occasions, and is a crucial pivot as highlighted in one of the previous analyses as well.
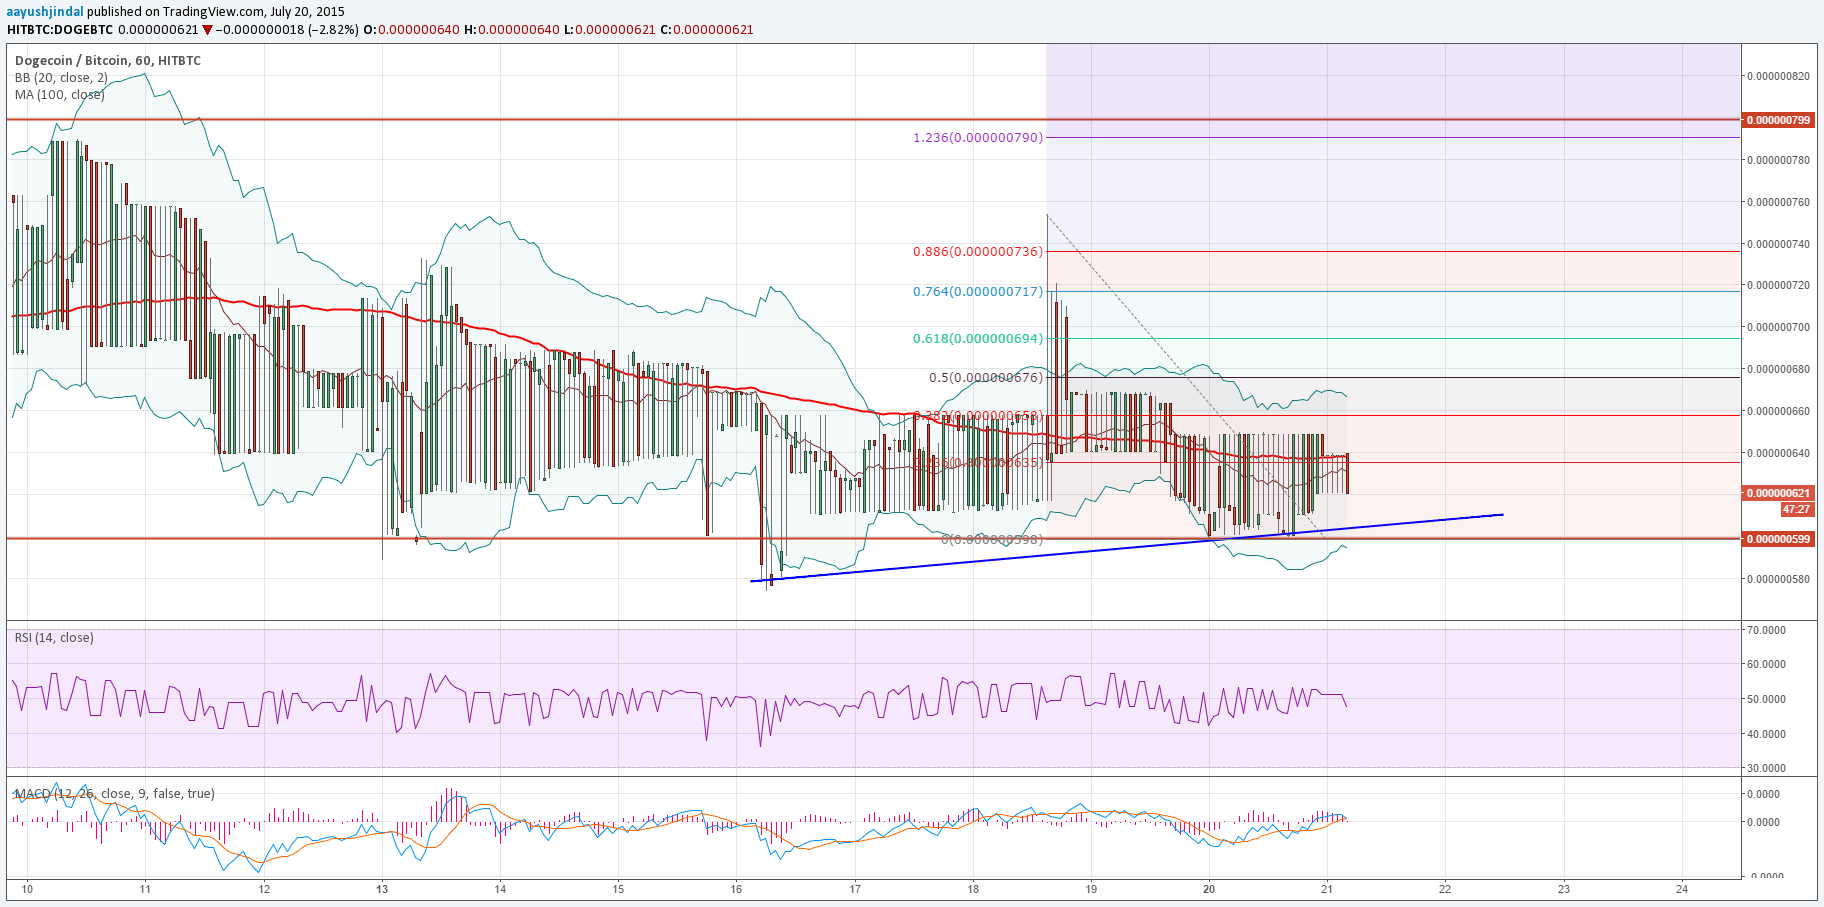
There is a bullish trend line formed on the hourly chart of Dogecoin, i.e. helping buyers in the short term and preventing losses. The price is currently below the 100 hourly simple moving average, which is a worrying sign, but as long as the price is above the highlighted trend line a move up cannot be discarded. On the upside, an initial hurdle is around the 38.2% Fib retracement level of the last drop from 75.2 Satoshis to 60.0 Satoshis. The Upper Bollinger Band is also positioned around the mentioned Fib level. A break above 64.0 Satoshis might take the price towards the 50% Fib level.
On the downside, highlighted bullish trend line could as a swing area. A break below it might call for more downsides moving ahead.
Intraday Support Level – 60.0 Satoshis
Intraday Resistance Level – 64.0 Satoshis
The hourly RSI has moved below the 50 level, warning buyers looking ahead.
Charts courtesy of Trading View