

Key Highlights
- Dogecoin price declined and traded below an important support area of 76.0 Satoshis as anticipated in yesterday’s analysis.
- It looks like the price is heading towards the next level of support at 71.0
- 100 hourly MA still remains a concern for buyers, as they failed to break it on many occasions.
We were right when we noticed a break in Dogecoin price chart, as there was a downside thrust Intraday.
What’s next?
We highlighted the possibility of a down-move in Dogecoin price yesterday, which continued as the price moved below a critical support of 76.0 Satoshis. There was a clear break noted, and there was a retest of the broken support area that acted as a resistance. There is now a descending channel formed on the hourly chart, i.e. likely to act as a catalyst in the near term. The price recently traded as low as 74.0 Satoshis, and corrected higher. However, it remains at risk of more declines, as sellers might attempt to take the price towards a major support area of 71.0-70.0 Satoshis.
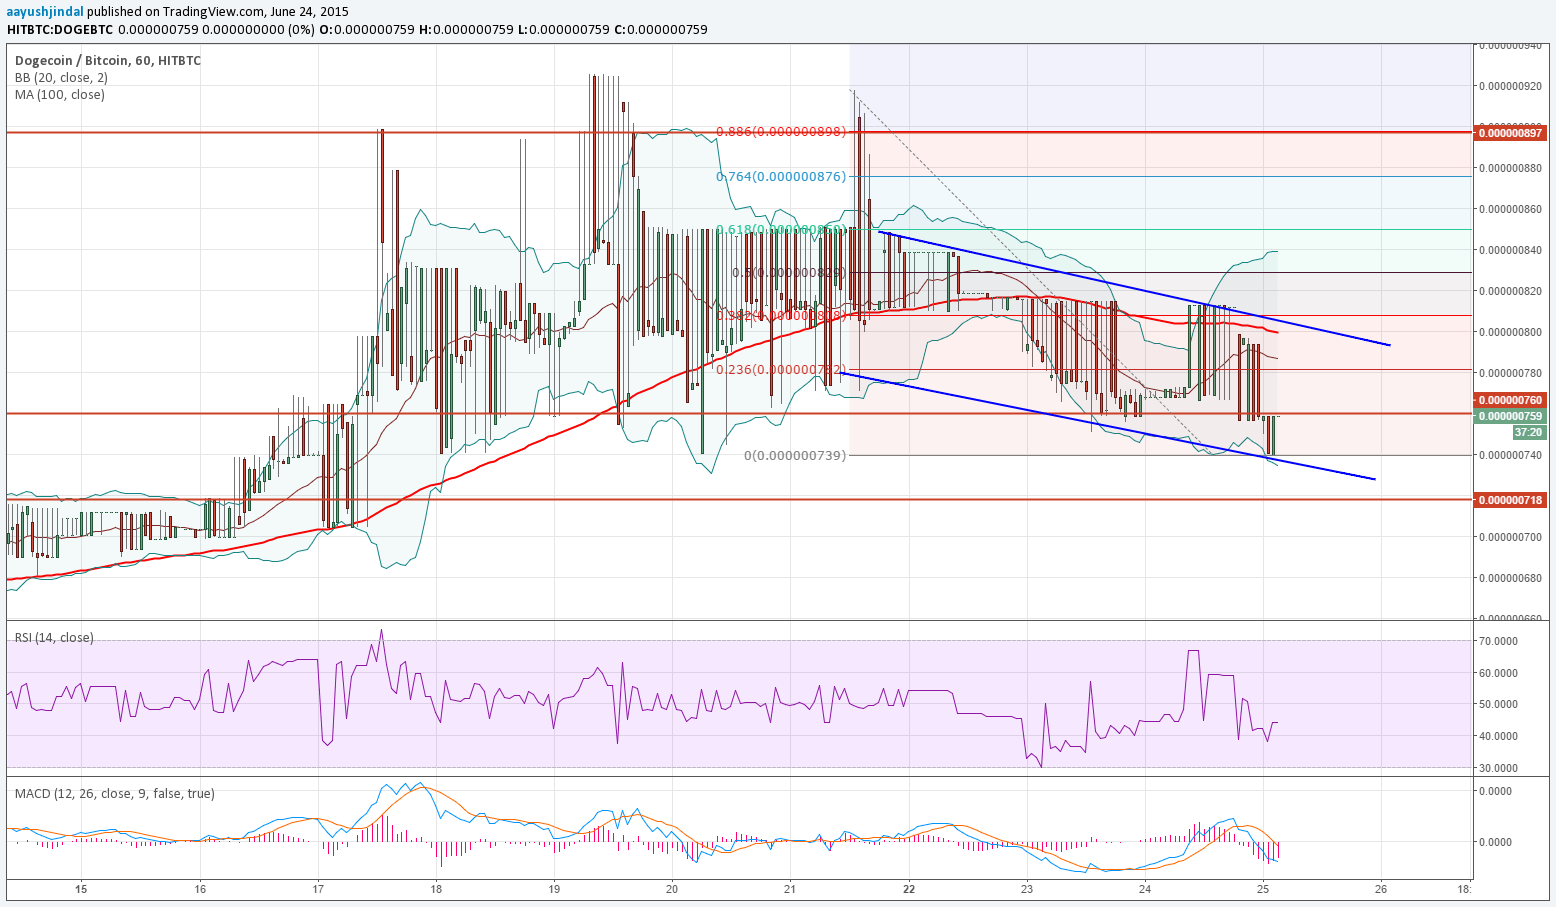
Sellers need to break the channel support area to take the price lower. On the upside, an initial hurdle is around the previous swing area of 76.0 Satoshis, i.e. providing resistance. A break above the same could take the price towards the 100 hourly simple moving average, which holds the key for more gains. The mentioned MA is sitting around the channel resistance trend line and the 38.2% Fib retracement level of the last drop from 91.8 Satoshis to 73.9 Satoshis.
The hourly RSI and MACD are signaling more losses, which is an encouraging sign for sellers.
Intraday Support Level – 71.0 Satoshis
Intraday Resistance Level – 80.0 Satoshis
Overall, the possibility of a move towards 70.0 Satoshis is increasing as sellers remain active.
Charts courtesy of Trading View