

Key Highlights
- Dogecoin price continued to trade in a range, as there was no real move in one particular direction.
- 0 Satoshis and 62.0 Satoshis remain key barriers for sellers in the near term.
- The market is positioned for a nasty move once the consolidation phase is completed.
Dogecoin price is hesitant to move in one particular direction, but once there is a break a solid move is likely.
Direction of Break
We stated that the Dogecoin price is consolidating since the last couple of days, as both buyers and sellers struggled to move things. There is a monster support forming around 64.0 Satoshis and 62.0 Satoshis. There is chance of a double bottom pattern forming around 62.0 Satoshis. If buyers get control and manage to move the price higher, then we need to see whether they can pierce the range resistance or not. The range resistance is currently around 66.0 Satoshis, which is sitting with the Upper Bollinger Band. A break above the same might set the tone for a move towards the next area of interest around the 38.2% Fib retracement level of the last drop from 82.0 Satoshis to 62.2 Satoshis.
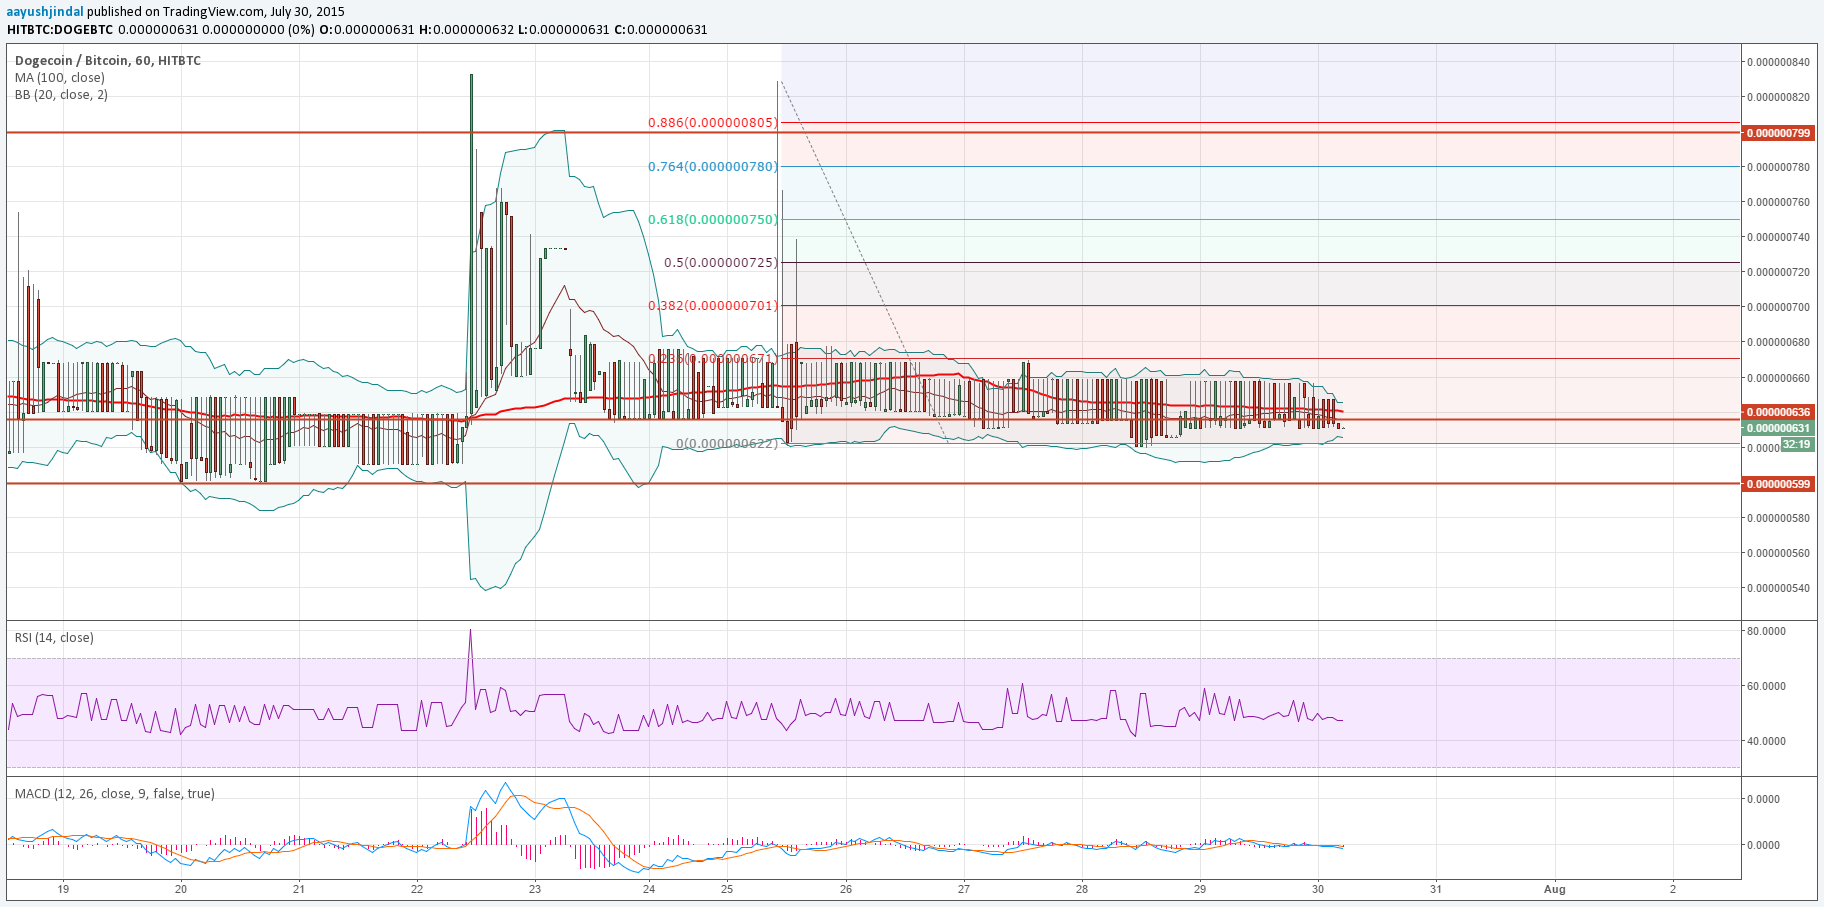
Any further gains might easily take the price towards the 50% Fib retracement level. On the downside, the Lower Bollinger Band is seen as a support, i.e. aligned with 62.0 Satoshis. If sellers managed to take the price below the stated support area, then the price might head towards 60.0 Satoshis, followed by 58.0 Satoshis. The 100 hourly simple moving average is moving inside the range area, which is a warning sign in the near term.
Intraday Support Level – 62.0 Satoshis
Intraday Resistance Level – 66.0 Satoshis
The hourly RSI is also not in a convincing state to point a break, which leaves the bias as neutral in the short term.
Charts courtesy of Trading View