
Key Highlights
- Dogecoin price continued to break higher and faced a monster resistance around a bearish trend line as highlighted in yesterday’s post.
- The price created a new low recently, and remains at risk of more losses in the near term.
- 100 MA continues to act as a pivot area for the price.
Dogecoin price failure to move above 76.0-78.0 Satoshis was a warning sign for buyers that resulted in a move lower.
Heading Lower?
Dogecoin price yesterday attempted one more time to take out a critical bearish trend line on the hourly chart. However, buyers failed once again to take the price higher, which resulted in a sharp decline. There was a new low created below 68.0 Satoshis, as the price fell towards 64.0 Satoshis. We forecasted recently that if buyers fail one more time, there might be a downside reaction. The recent decline found support just around 65.0 Satoshis, and moved back higher. The upside was stopped around the 100 hourly simple moving average, which acted as a pivot for the price. Moreover, the mentioned MA was also colliding with the 75.4% Fib retracement level of the last drop from 79.2 Satoshis to 64.7 Satoshis.
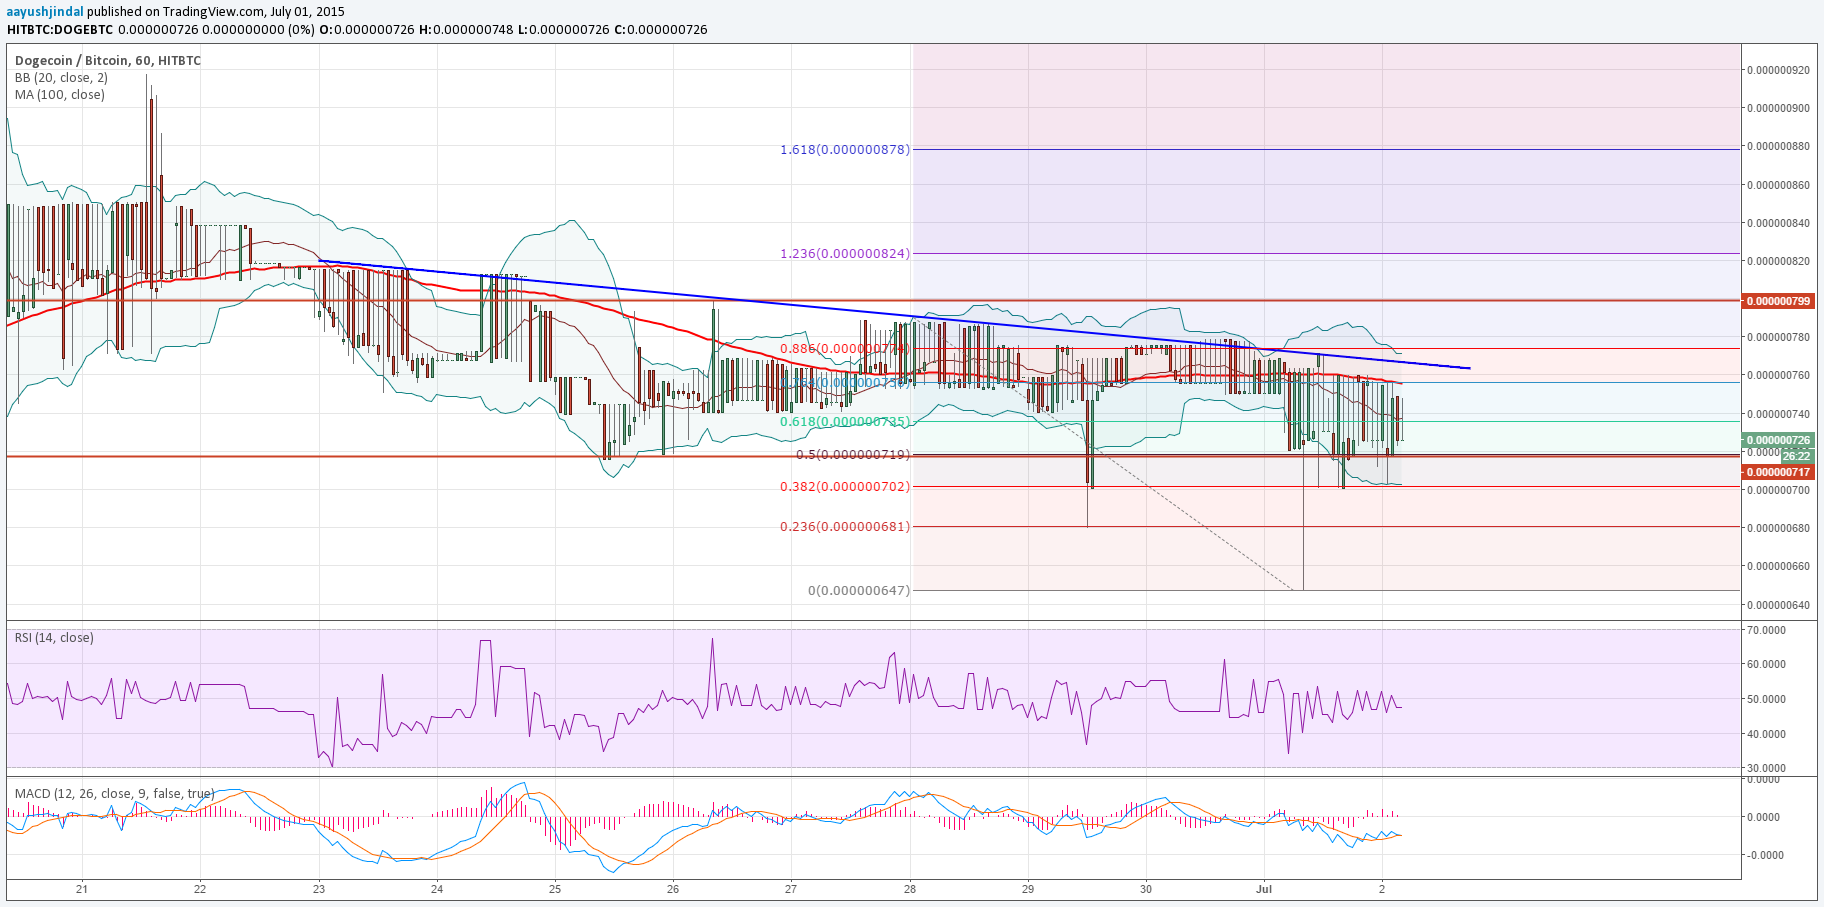
As long as the price is below the highlighted bearish trend line, sellers remain in control. Currently, it looks like they are attempting one more push lower, meaning there is a chance of a new low in the near future.
The Lower Bollinger Band might come into pay as a support, and if it is broken the price might head towards the last swing low of 64.7 Satoshis.
Intraday Support Level – 74.0 Satoshis
Intraday Resistance Level – 78.0 Satoshis
Let us see how long sellers can manage to defend the upside. Any further losses might find strong buying interest around 60.0 Satoshis.
Charts courtesy of Trading View