
Key Highlights
- Dogecoin buyers failed on many occasions to take prices above 60.0 Satoshis.
- Range is contracting on the hourly timeframe, which suggests that a break is on the cards in the near term.
Our highlighted double top pattern is still valid, and as long as the price of Dogecoin is below 60.0 Satoshis, there is a risk of a major decline moving ahead.
Contracting Range
Dogecoin price action is getting complex, and it looks like 60.0 Satoshis is turning out to be a major barrier for buyers. We highlighted a double top pattern in one of the previous analyses, which is still intact. However, just as buyers struggled to take prices higher, sellers too failed to ignite a downside move. Prices are stuck in a range, which is contracting every 4-hours.
Recently, Dogecoin price fell to 52.0 Satoshis where it found buyers and traded back higher. However, 60.0 Satoshis once again acted as a barrier and ignited a down-move. Currently, prices are around the 38.2% Fib retracement level of the last leg from 50.0 Satoshis to 59.3 Satoshis. A break below the same might call for more losses towards the 50% Fib level. The mentioned level is coinciding with the Lower Bollinger Band.
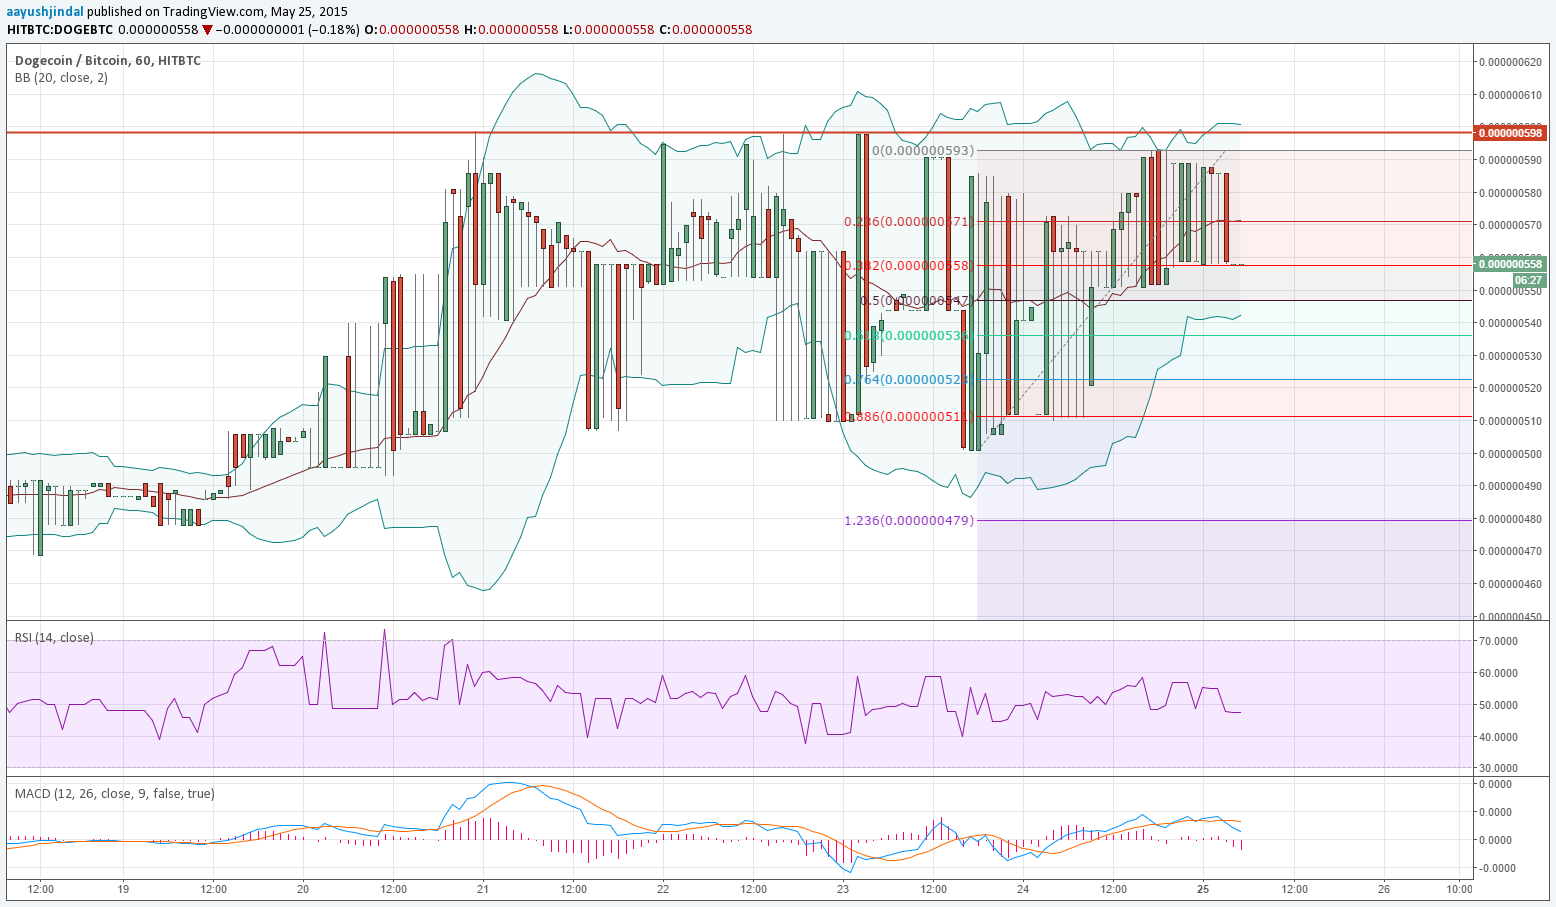
As it can be clearly seen from the hourly chart of Dogecoin, the Bollinger Bands are shrinking, pointing towards the fact that the range break is near. Both, buyers and sellers need to be very careful, as there can be nasty moves once prices break higher or lower.
Intraday Support Level – 55.0 Satoshis
Intraday Resistance Level – 60.0 Satoshis
When we look at the technical indicators, then we can conclude that the possibility of a break lower is more compared with a move higher. The hourly RSI is below the 50 level and MACD is bending its back towards the bearish zone.
Charts courtesy of Trading View