

Key Highlights
- Dogecoin price struggle continued, as buyers failed to take the price above 80.0
- On the downside, the last swing low of 71.8 Satoshis is a major barrier for sellers.
- Most technical indicators signaling more losses, but none of them is convincing enough.
Dogecoin price action was very tricky during this past week, as every technical indicator/signal was not as per trader’s expectation.
100 MA as a catalyst
Dogecoin buyers managed to take the price higher on many occasions, but they failed to break a critical resistance area around 78.0-80.0 Satoshis. There is a bearish trend line formed on the hourly chart, which stalled the upside. Moreover, there were failures around the 38.2% Fib retracement level of the last drop from 91.8 Satoshis to 71.8 Satoshis. There is a major catalyst for Dogecoin price is the form of the 100 hourly simple moving average. It acted as a support and resistance on many occasions.
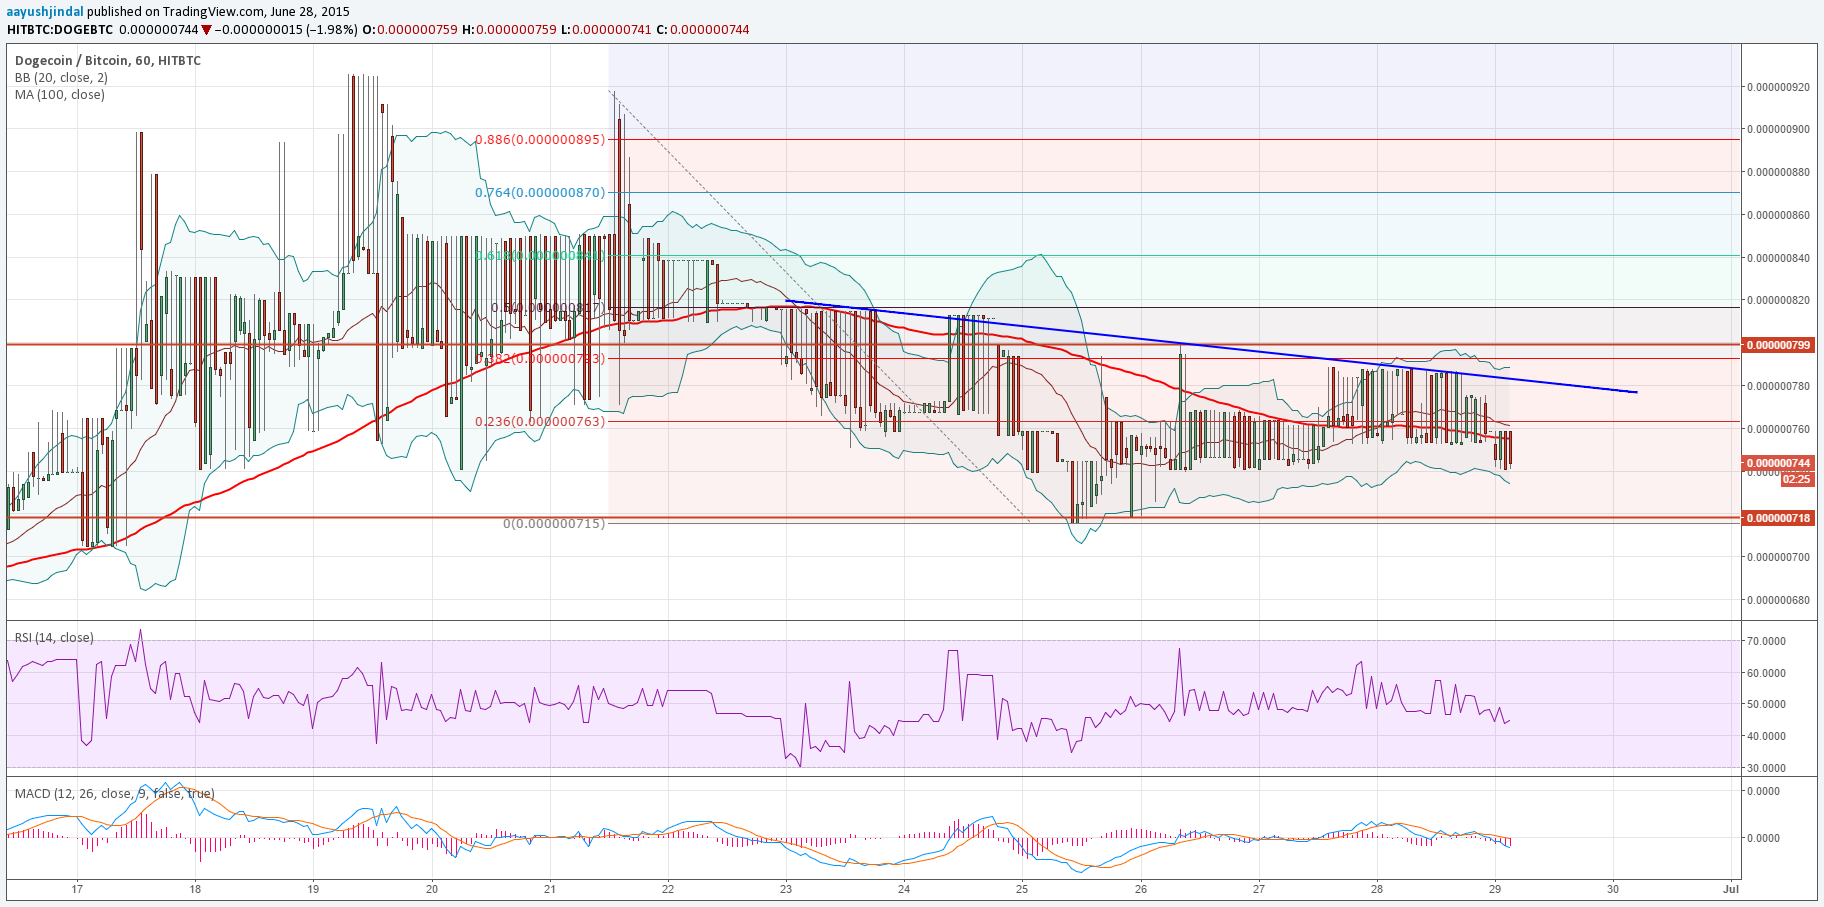
On the upside, the highlighted trend line along with the Upper Bollinger Band could continue to act as a hurdle for buyers. If there is an hourly close above the same, followed by a break above the 38.2% Fib level. The next level of interest if we witness a break might be around the 50% Fib level.
On the downside, the Lower Bollinger Band may provide support in the near term. Any further losses could take the price towards the last swing low of 71.8 Satoshis that holds the key moving ahead. It might be tough for sellers to pierce the mentioned fib level.
The hourly RSI and MACD are pointing more losses, which can be considered as a worrying sign for buyers.
Intraday Support Level – 72.0 Satoshis
Intraday Resistance Level – 76.0 Satoshis
Overall, there can be ranging moves unless buyers or sellers get a reason for swing moves.
Charts courtesy of Trading View