

Dogecoin Price Key Highlights
- Dogecoin price finally spiked higher and traded above a major bearish trend line.
- The trend line break was not convincing, and it might be the case that it could be a false one.
- The price is trading around 100 hourly simple moving average, and if there is a satisfactory close above it more gains are likely.
Dogecoin price spiking above the bearish trend line was a good sign, but it might still trade in a range moving ahead.
Range Persists?
The Dogecoin price after trading for a long time inside a tiny range and below a major bearish trend line managed to trade higher. Buyers took the price above the highlighted bearish trend line and resistance area, but the break was not convincing. The price after trading close to a monster resistance area at 67.0 Satoshis found sellers. The stated level also represented the range resistance area, which resulted in a move lower. The price is currently trading near the broken trend line, and the 100 hourly simple moving average. We need to see whether buyers manage to defend the downside or not.
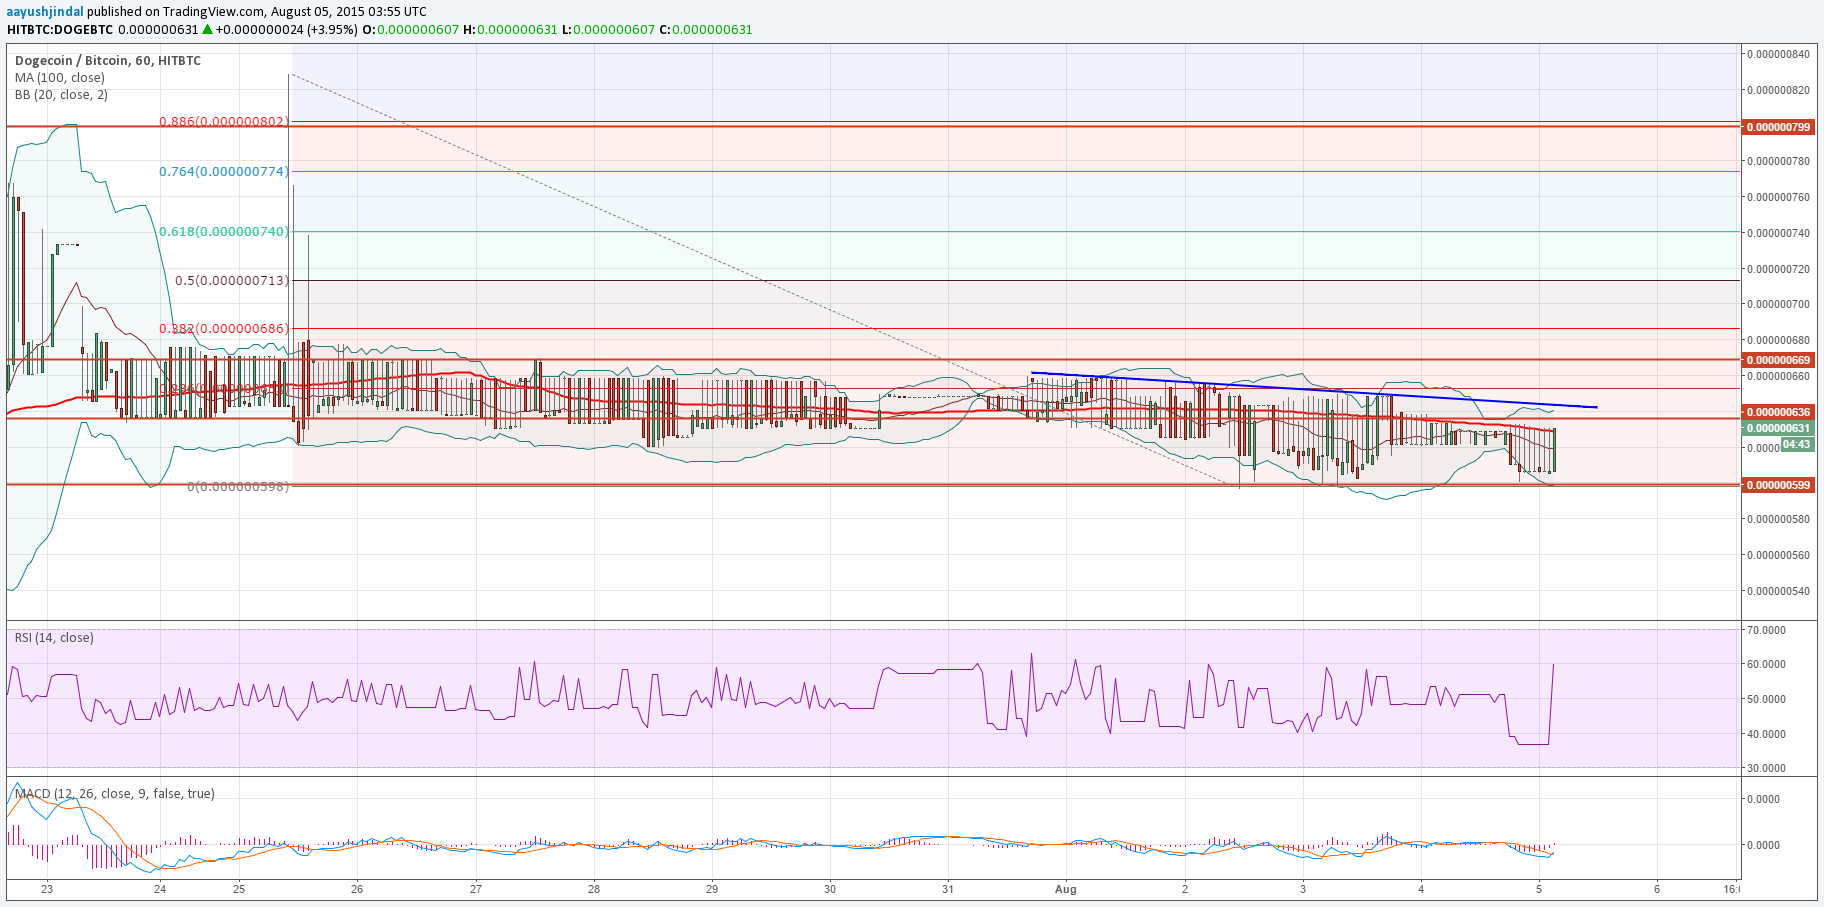
A break and close below the 100 hourly SMA would negate the bullish view, and might call for a move back towards the range support area. The price has already moved a lot and even cleared the 61.8% Fib retracement level of the last wave from 59.9 Satoshis to 67.0 Satoshis. So, we need to see if the recent break was a false one or not.
On the upside, a move above 62.0 Satoshis could set the price for a retest of the recent swing high of 67.0 Satoshis.
Intraday Support Level – 60.0 Satoshis
Intraday Resistance Level – 64.0 Satoshis
The hourly RSI and MACD are showing positive signs for a change.
Charts courtesy of Trading View