

Dogecoin Price Key Highlights
- Dogecoin price fell and traded close to our first sell target of 76.0 Satoshis as anticipated in yesterday’s analysis.
- There was a buying interest noted around 71.0 Satoshis where sellers stepped back.
- The bearish pressure remains intact, as there are many hurdles formed on the upside for buyers.
Our forecast of a move lower was right, as there was a downside reaction Intraday taking the price towards 71.0 Satoshis.
What’s next?
Yesterday, the price broke a critical support area of 76.0 Satoshis, which was one of the main reasons we thought that the price might head towards 71.0 Satoshis. There was a downside move, and 71.0 Satoshis area was tested by sellers Intraday. The price was as low as 71.8 Satoshis where buyers appeared to defend the downside. There was a sharp reaction noted around the mentioned support area, as it was also colliding with the Lower Bollinger Band. The price corrected higher and tested the 23.6% Fib retracement level of the last drop from 91.8 Satoshis to 71.8 Satoshis.
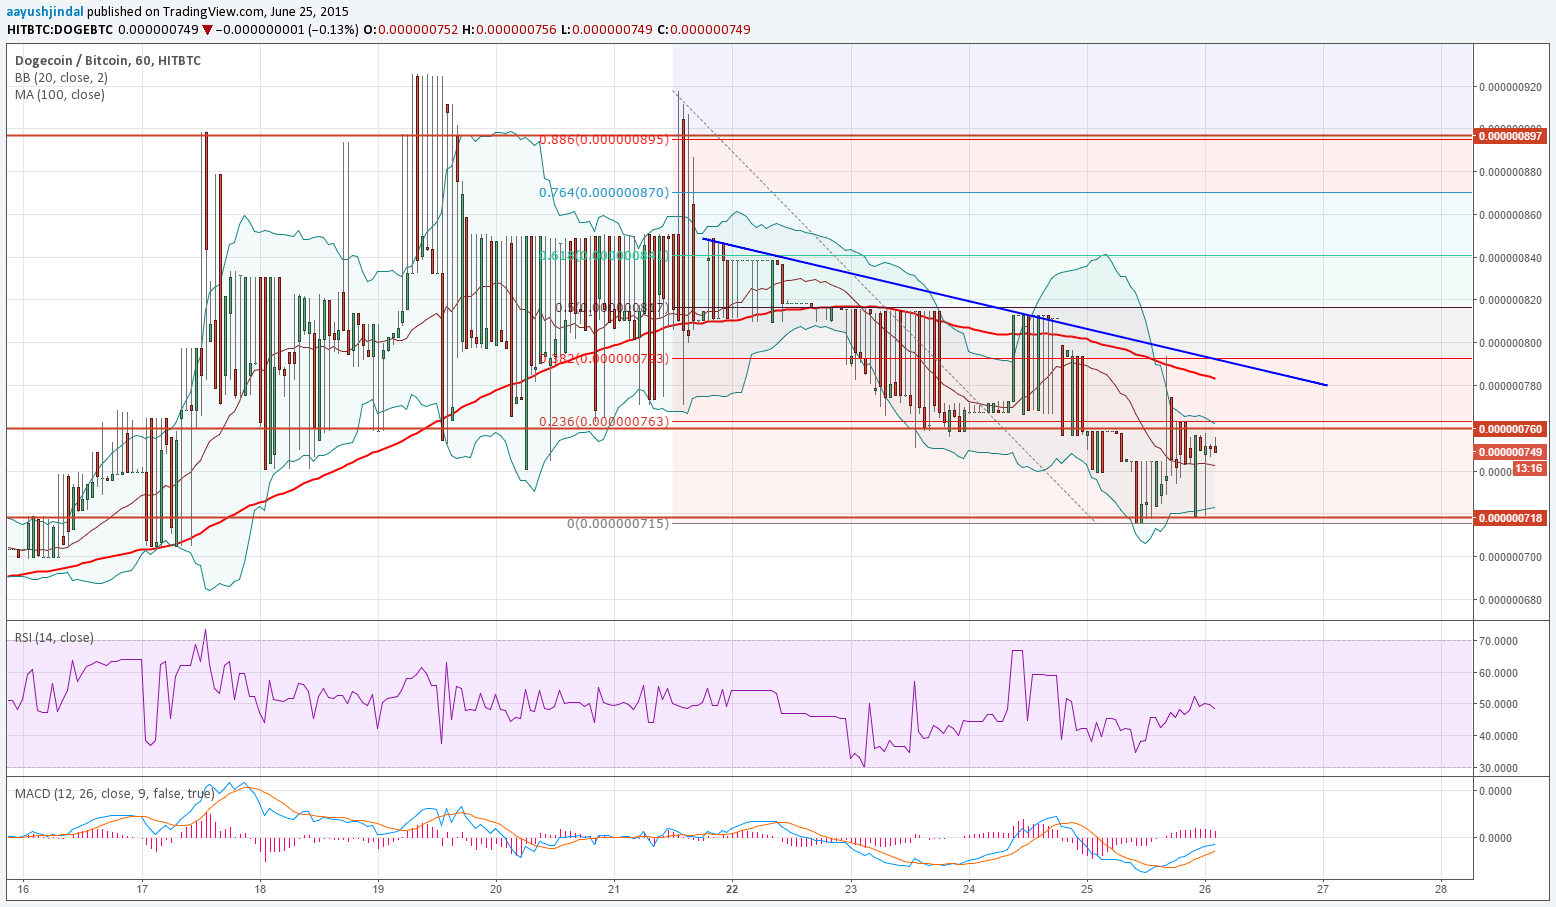
There are many barriers formed around the 100 hourly simple moving average, which is aligned with a bearish trend line. Moreover, the 38.2% Fib retracement level is also positioned around the 100 MA to increase the importance of the resistance. If buyers manage to break the 23.6% Fib level, then sellers might be tested around the 100 MA, which can be seen as a pivot area in the short term. There were many attempts earlier to break the stated MA, but buyers failed to take the price above it.
The hourly RSI recently failed to move above the 50 level, signaling a short-term failure.
Intraday Support Level – 71.0 Satoshis
Intraday Resistance Level – 76.0 Satoshis
In short, the buyers might face a tough time as long as the price is below the 100 MA.
Charts courtesy of Trading View