
Dogecoin Price Key Highlights
- Dogecoin price continues to trade in a tiny range, but there is an increase in volatility noticed, which might result in a break moving ahead.
- A minor low below 62.0 Satoshis support area was created, but sellers failed to take the price below 60 Satoshis.
- 0 Satoshis on the upside remains a major barrier for buyers in the near term.
Dogecoin price is showing signs of the increase in volatility, which might result in a break in the near future.
What’s next?
There has been continuous range trading this past week, and it turned out to be frustrating for investors, as there was no real movement for trading. However, as the price was trading in a range, there was a minor downside reaction noted below a critical support at 62.0 Satoshis. However, the next barrier at 60.0 Satoshis stalled the downside and pushed the price back higher. The Bollinger Bands also expanded and pointing towards the increase in volatility in the short term.
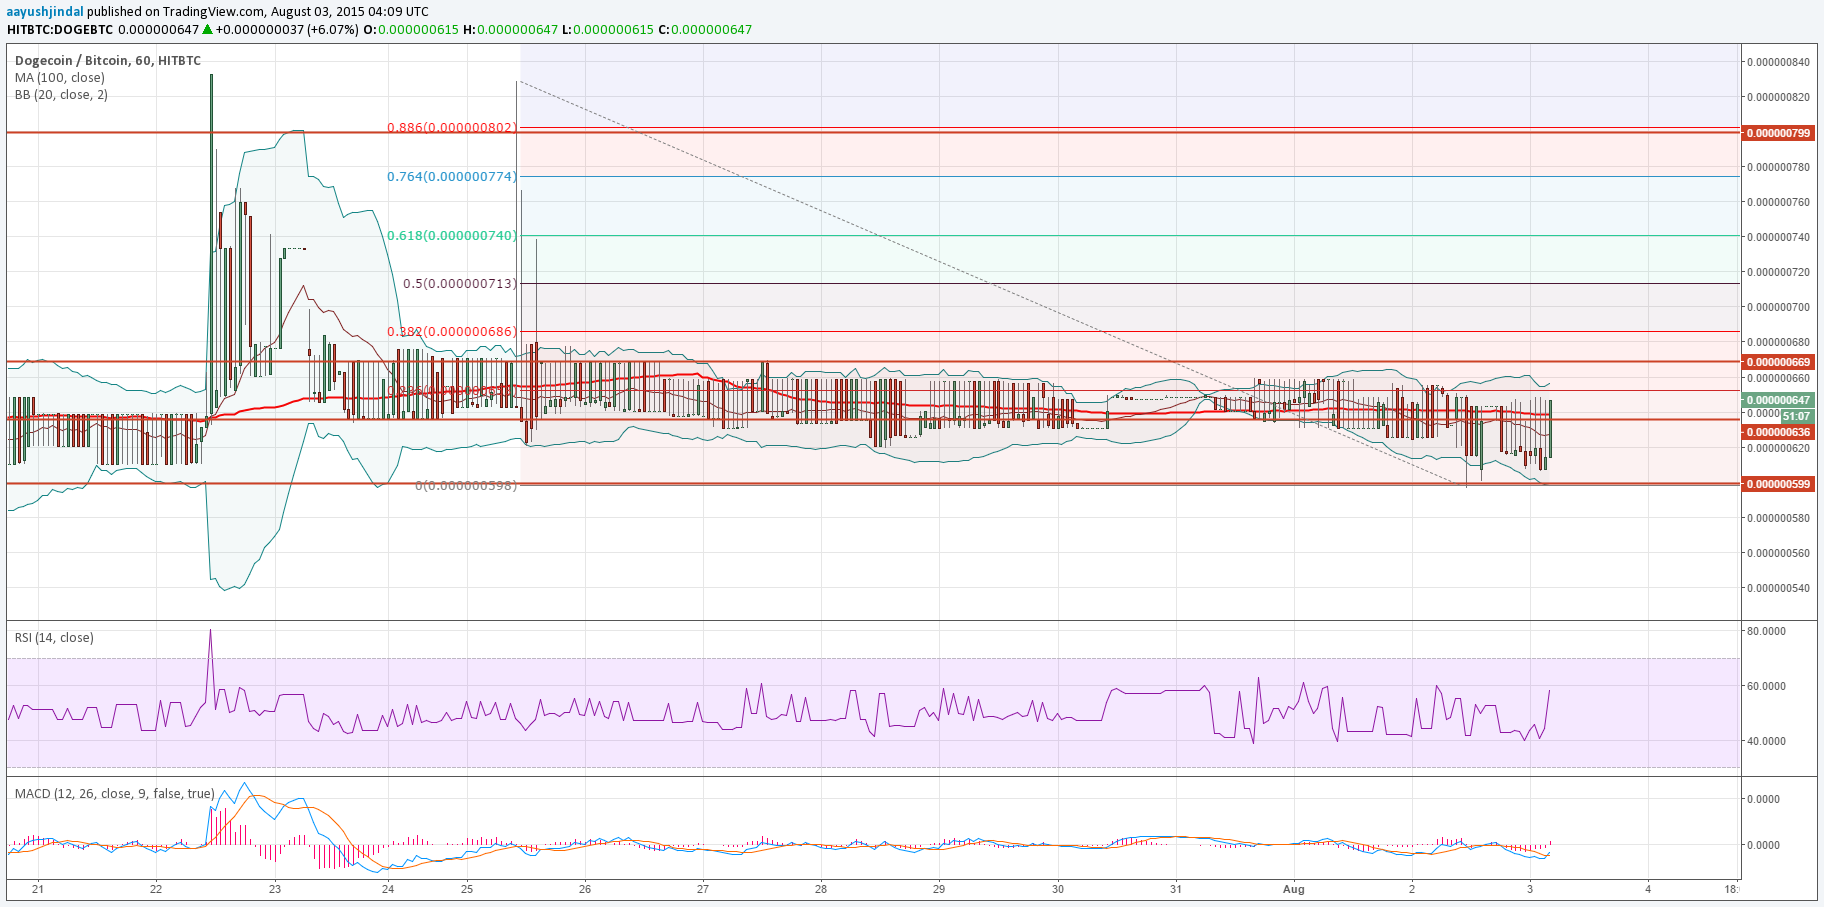
We need to see how the price behaves moving ahead and whether it can clear 60.0 Satoshis support area or not. A break below the stated support area would ignite a downside reaction, which might take the price towards the previous weekly pivot of 54.0 Satoshis. One worrying sign here is that the price is struggling to settle above the 100 hourly simple moving average.
On the upside, the first hurdle for buyers to take the price above the 100 hourly SMA. If they succeed, then the Upper Bollinger Band, coinciding with the 23.6% Fib retracement level of the last drop from 82.0 Satoshis to 59.8 Satoshis might come into play.
Intraday Support Level – 62.0 Satoshis
Intraday Resistance Level – 66.0 Satoshis
The hourly RSI is moving up and down, and not showing any sign of a break in the short term.
Charts courtesy of Trading View