

Key Highlights
- Another attempt to pierce 70.0 Satoshis failed, as Dogecoin price continues to consolidate.
- Buyers look like setting up for a rally as all major indicators point more gains.
- A 4-hours close above 70.0 Satoshis might be a catalyst for an upside move.
Dogecoin resiliency was surprising, which increases the chance of it trading higher in the near term.
Trend Line Support
Dogecoin price recently traded a touch higher above 70.0 Satoshis to trade as high as 71.8 Satoshis where it struggled. The price moved back lower and currently trading around an important bullish trend line on the hourly chart. The Lower Bollinger Band is also aligned perfectly with the highlighted trend line, which suggests that 65.0 Satoshis is a major support for Dogecoin. The Bollinger Bands are contracting, pointing towards the fact that a break is on the cards in the short term.
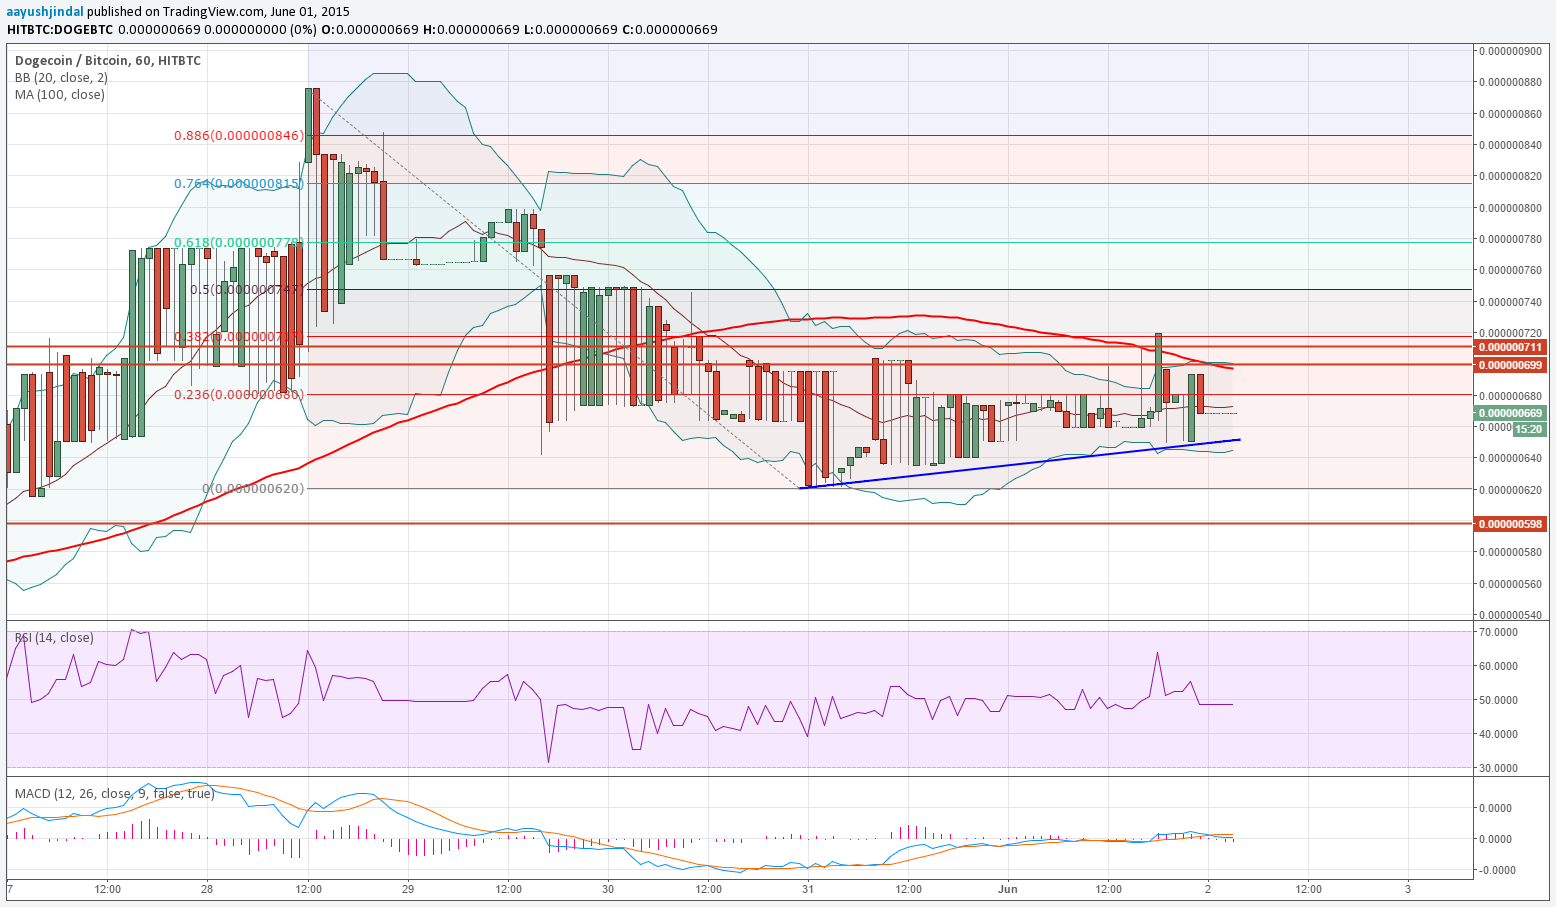
On the downside, a break below the highlighted trend line could take prices toward the last low 62.0 where buyers might take a stand to protect further losses. On the upside, a crucial resistance lie at 100 hourly simple moving average, i.e. positioned around 70.0 Satoshis. No doubt, buyers might struggle to clear the 100 SMA, and if they succeed in settling the price above the mentioned level, then Dogecoin price could surge higher. There is one more hurdle around the 50% Fib retracement level of the last drop from 87.7 Satoshis to 62.0 Satoshis.
The hourly RSI is just below the 50 level, but that cannot be considered bearish as it might climb back higher once buyers are active again.
Intraday Support Level – 65.0 Satoshis
Intraday Resistance Level – 70.0 Satoshis
In short, Dogecoin remains a buy as long as the bullish trend line and the last low of 62.0 is intact.
Charts courtesy of Trading View