
Dogecoin Price Key Highlights
- Dogecoin price failed once again to break in one direction, and continued to trade in a range.
- 0 Satoshis on the downside and 68.0 Satoshis on the upside are range support and resistance areas.
- There are no signs of a break as the price continues to consolidate this week.
Dogecoin price failure to break is a worrying sign, and points to a nasty move in the near term.
We are waiting for a break for the last couple of days, but both sellers and buyers failed to take the price higher or lower. It leaves the price trading in a range, and there is no real action in the short term. On the downside, we have been tracking a major support area around 64.0 Satoshis and 62.0 Satoshis. Let us see how long buyers can manage to hold the mentioned support area and whether sellers could take it down or not.
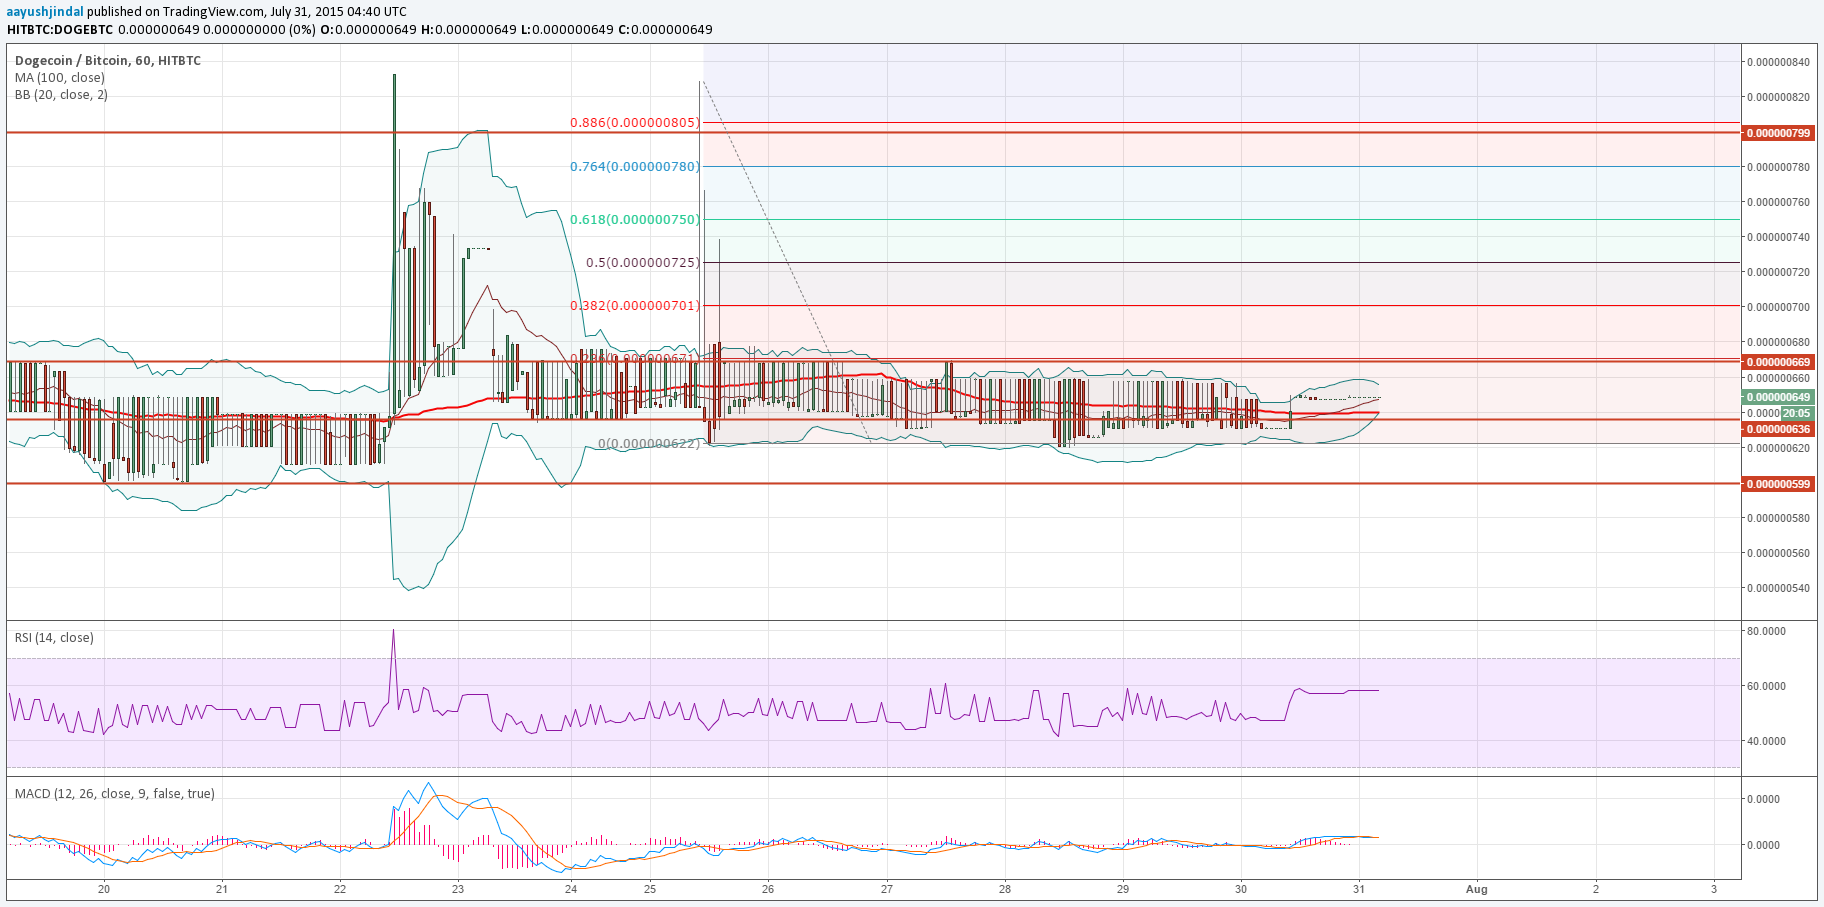
The Lower Bollinger Band is now aligning with the 100 hourly simple moving average, which is around 64.0 Satoshis. Moreover, one of the major support levels is positioned around 62.0 Satoshis. However, there is also a swing support area around 60.0 Satoshis, which can be seen as the next barrier for sellers if they manage to break 64.0 Satoshis.
On the upside, the first hurdle for buyers is around the Upper Bollinger Band, followed by the range resistance area. The range resistance area is around the 23.6% Fib retracement level of the last drop from 82.0 Satoshis to 62.2 Satoshis. The 100 hourly simple moving average is also a major factor and might play a critical role.
Intraday Support Level – 62.0 Satoshis
Intraday Resistance Level – 66.0 Satoshis
The hourly RSI spiked once and forming a divergence, suggesting a break is possible moving ahead.
Charts courtesy of Trading View