
Key Highlights
- Dogecoin price attempted to recover some ground after a sharp decline towards 37.0 Satoshis.
- There is a major bearish trend line on the hourly chart as highlighted in one of previous analysis, which prevented gains.
- The price is trying to settle above the 100 hourly simple moving average, which is a positive sign.
Dogecoin price showing a few bullish signs on the hourly chart, as it managed to settle above an important pivot area of 38.0 Satoshis.
Can it settle above 100 MA?
There was a sharp upside reaction noted in the Dogecoin price, as it moved higher closer to 45.0 Satoshis. However, there was a strong selling interest noted around the mentioned area, as the highlighted bearish trend line on the hourly chart acted as a barrier. There was a major rejection noted around the trend line and resistance area, and the price moved back lower. The main thing to note about this move was the fact that the price settled above a critical area of 38.0 Satoshis. This means there is a chance of more upside leg in the near term.
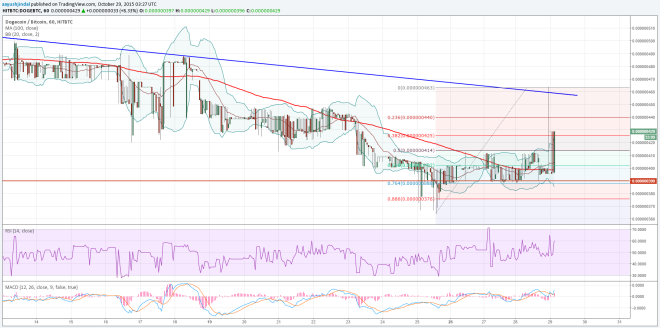

Moreover, the price is currently attempting to close above the 100 hourly simple moving average. If buyers manage to succeed then it would be great for more gains moving ahead. The 61.8% Fib retracement level of the last move from 36.4 Satoshis to 46.3 Satoshis is acting as a support for now. A break below it might take the price towards the 76.4% Fib level.
On the upside, we need to keep an eye on the bearish trend line and resistance area.
Intraday Support Level – 38.0 Satoshis
Intraday Resistance Level – 42.0 Satoshis
The hourly RSI is above the 50 level, which means that there is a possibility of a move higher.
Charts courtesy of Trading View