

Key Highlights
- Dogecoin price managed to recover ground, as an important support area around 30.0 Satoshis stalled declines.
- We highlighted a major resistance area in yesterday’s post around 38.0-40.0 Satoshis, which is currently acting as a barrier for buyers.
- The hourly MACD looks like changing slope to the bearish zone, suggesting that the price is struggling to clear the stated resistance area.
Dogecoin price managed to correct higher Intraday, but there is no doubt that buyers may find it very difficult to break through the 40.0 Satoshi level.
Can we Buy Now?
It would be tough to say that the price has entered into the bullish zone. As I mentioned yesterday, there is a monster resistance around 38.0-40.0 Satoshis and as long as the price is below, buying is not a good deal. However, on the other hand, there are a few positive signs emerging on the hourly chart. First, the price was successful in settling above the 38.2% Fib retracement level of the last leg from the 41.8 Satoshis (high) to 30.6 Satoshis (low).
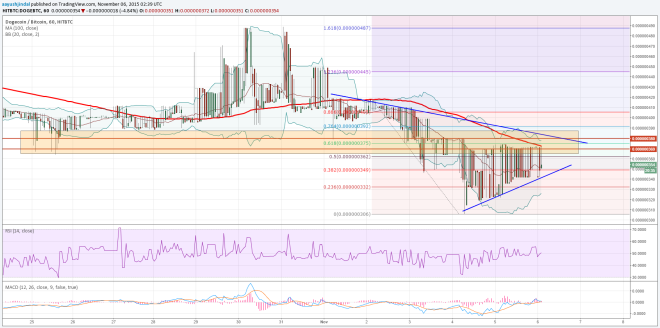

Second, the hourly RSI (Relative Strength Index) managed to settle above the 50 level, which suggests that buyers are attempting for a break. If they manage to clear the highlighted trend line and resistance area around 38.0-40.0 Satoshis, then there is a possibility of a spike higher in the near term.
Looking at the indicators:
MA – The 100 hourly simple moving average (SMA) is positioned around the 618% Fib level (41.8 Satoshis high to 30.6 Satoshis low), pointing towards the importance of 40.0 Satoshis.
RSI – Warning for buyers, as it just moved below the 50 level.

On the downside, there is a bullish trend line formed that may act as a support moving ahead.
Intraday Support Level – 35.0 Satoshis
Intraday Resistance Level – 38.0 Satoshis
Traders need to have patience until there is a break above the trend line and resistance area before buying.
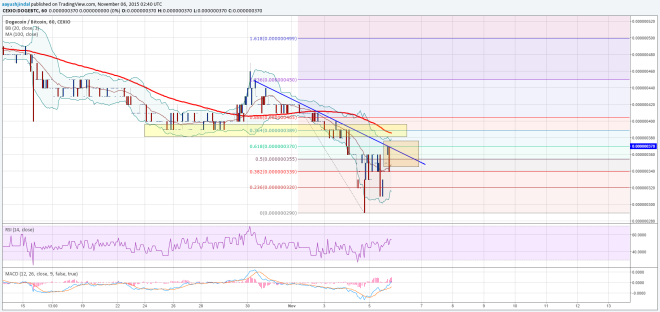
Charts from HITBTC and CEXIO; hosted by Trading View