

Key Highlights
- Dogecoin price broke down and cleared an important triangle support area recently.
- A new weekly low was formed around 57.5 Satoshis where buyers managed to protect further losses.
- 100 hourly simple moving average was also breached, which might now act as a resistance for buyers.
Dogecoin price traded lower, and cleared several support areas, suggesting that more losses are possible moving ahead.
Downside Moves
Yesterday, we highlighted a triangle pattern, which we were expecting to break and pave the way for the next move. There was a break noted, as sellers managed to take the price lower. The downside was not sharp, but there was a new low created below 58.0 Satoshis. There was a triangle pattern formed (as highlighted yesterday), which was breached towards the downside. The most important point is a break below the 100 hourly simple moving average, and the price settling below it.
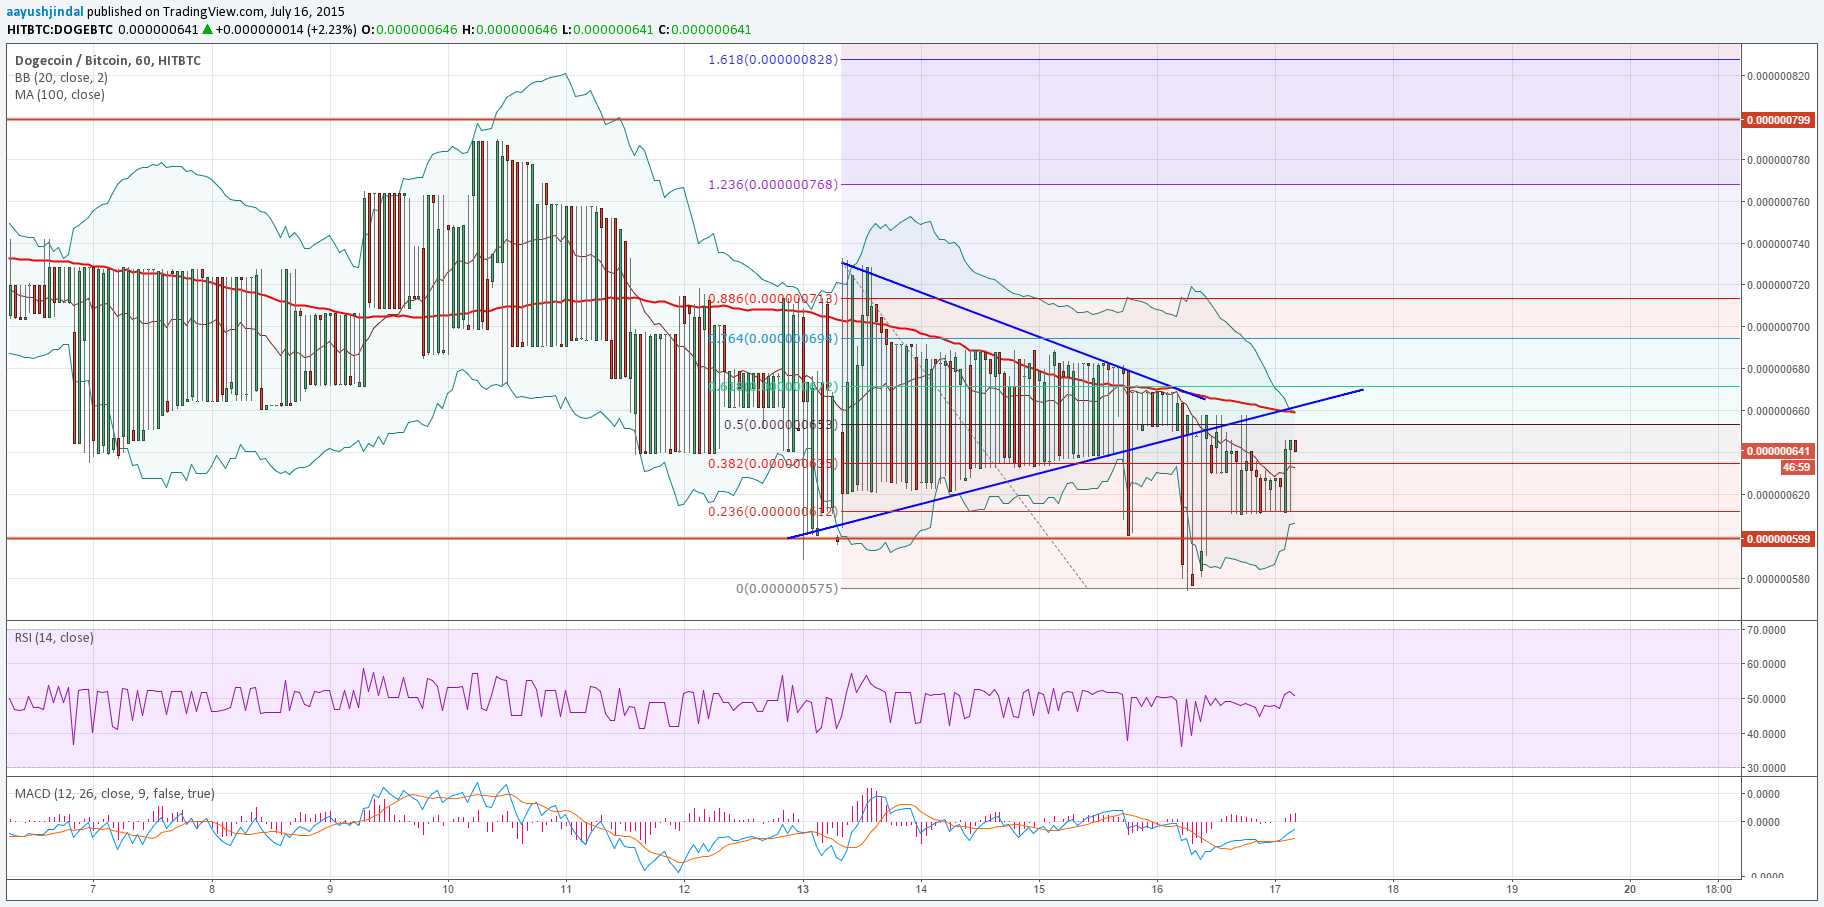
Buyers managed to protect losses around 57.5 Satoshis, and pushed the price back higher. Currently, the price is heading towards a monster resistance area around 66.0 Satoshis. The mentioned level represents a confluence area of the 50% Fib retracement level of the last drop from 73.0 Satoshis to 57.5 Satoshis, the broken triangle lower trend line and the 100 hourly simple moving average. There is a high probability that sellers might try their best to defend more upsides around 66.0 Satoshis, as it looks like a monster barrier for buyers.
On the downside, the Lower Bollinger Band is a major support area, which is aligned with a previous swing level of 60.0 Satoshis. Any further downsides might push the price towards the recent low of 57.5 Satoshis.
Intraday Support Level – 60.0 Satoshis
Intraday Resistance Level – 66.0 Satoshis
There is a minor divergence forming on the hourly RSI, which might push the price higher in the short term.
Charts courtesy of Trading View