

Dogecoin Price Key Highlights
- Dogecoin price continued to move lower as anticipated in yesterday’s post and looks poised for more losses.
- An important support area of 60.0 Satoshis was breached, which is acting as a resistance for buyers.
- A new bearish trend line is forming, which could act as a barrier if the price moves higher.
Dogecoin price weakened Intraday, broke a major support area and looks poised for more declines in the short term.
60.0 Satoshis as Barrier
There was a downside continuation noted, as the price moved below a major support area of 60.0 Satoshis. The stated level was breached, and the price settled below it. It found support near the 61.8 Fib retracement level of the last wave from 53.5 Satoshis to 65.9 Satoshis. It made an attempt to correct higher, but the broken support near acted as a resistance for buyers. We highlighted a bullish trend line on the hourly chart, which was breached to open the doors for more declines. Now, there is a bearish trend line formed on the hourly chart, which is positioned around the 100 hourly simple moving average (SMA).
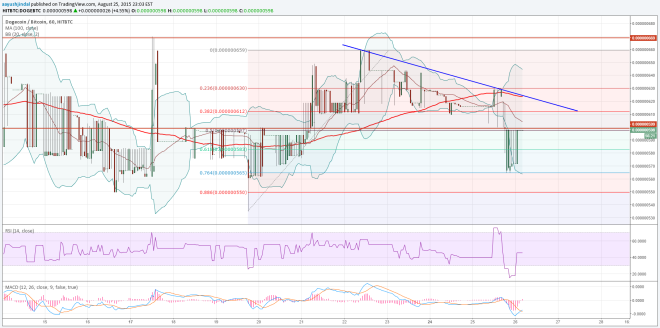

If the price somehow manages to clear 60.0 Satoshis, the next barrier for buyers may be around the Middle Bollinger Band. However, the most important resistance remains around the trend line and 100 SMA resistance area. A break above might release the bearish pressure and set the price for a move toward the last swing high of 67.0 Satoshis.
On the downside, the 76.4% Fib level holds the key, as a close below it could ignite a move towards the last swing low of 54.0 Satoshis where buyers might appear once again.
Intraday Support Level – 56.50 Satoshis
Intraday Resistance Level – 60.0 Satoshis
The hourly RSI and MACD are in the negative zones, suggesting more downsides.
Charts courtesy of Trading View