
Key Highlights
- Dogecoin climbed one more time, but failed to create a new high above 92.6 Satoshis.
- The price is struggling to settle above 90.0 Satoshis, which is a worrying sign.
- Our previous week’s bullish trend line proved worth, and protected downsides recently.
Buyers continued to buy Dogecoin whenever the price moved lower as sellers struggled lately to protect gains.
Importance of 90.0 Satoshis
In the weekly analysis, we highlighted that the price created a new high and traded as high as 92.6 Satoshis. After a short-term correction, the price once again found support around an important bullish trend line on the hourly chart. The stated trend line is acting as a major hurdle for sellers, and it is likely to act as a pivot area moving ahead. However, on the topside there are a couple of failures noted around 90.00-92.00 Satoshis. So, there is a risk emerging in the short term of a break lower.
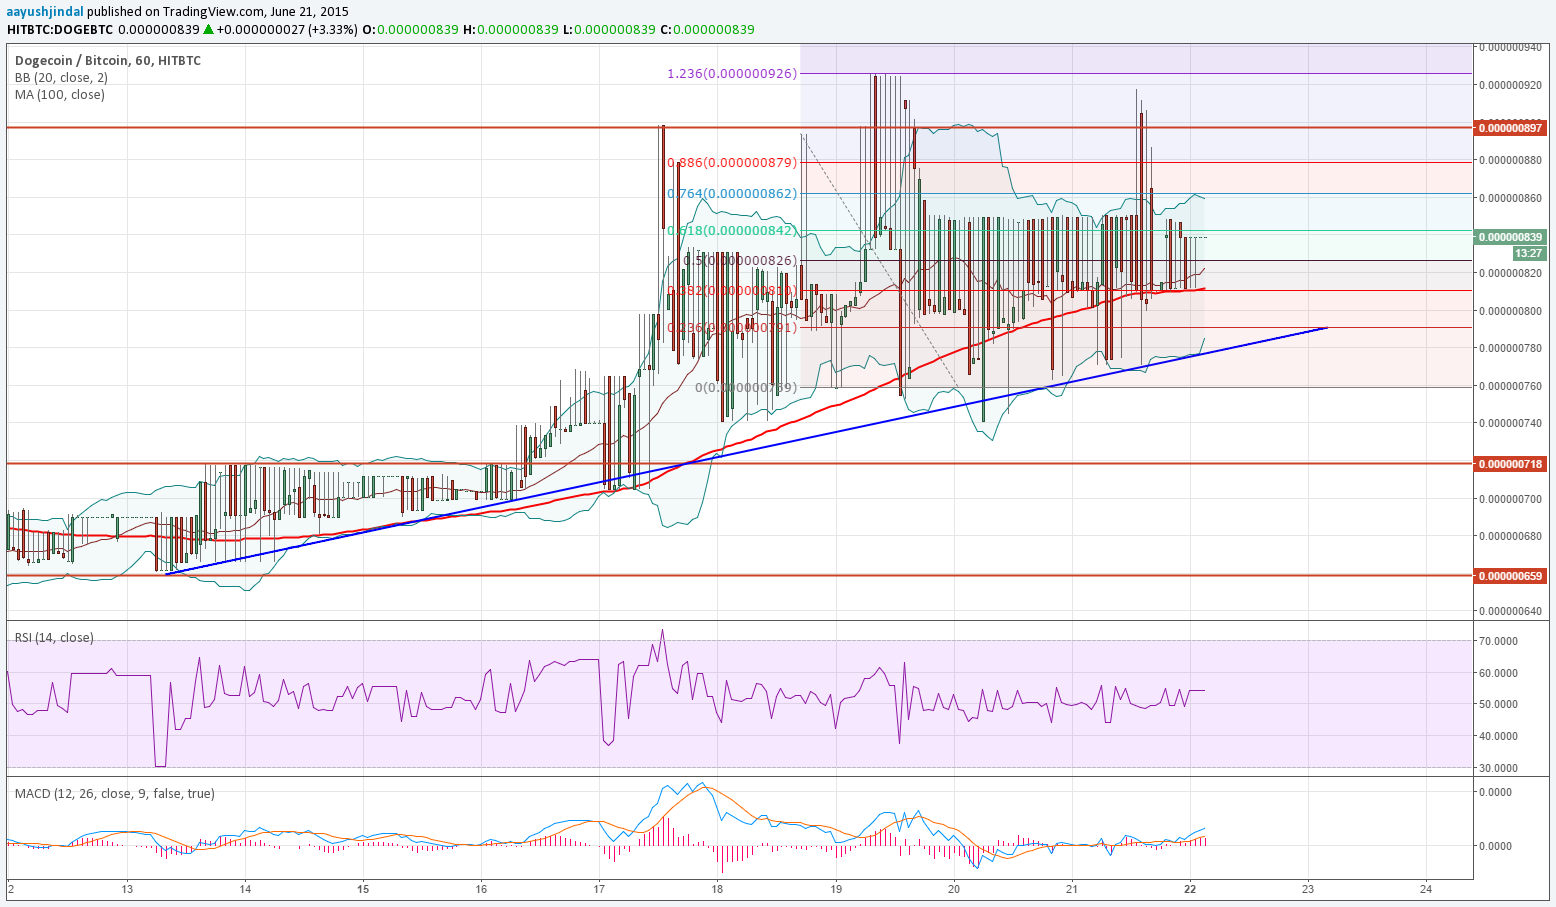
There is one more catalyst, i.e. the 100 hourly simple moving average. The price is finding bids around it and as long as it continues to provide support, there is a possibility of a new high above 92.6 Satoshis. The Lower Bollinger Band is sitting around the highlighted bullish trend line, which increases the value of support.
On the upside, the 1.236 extension of the last major drop from 89.3 Satoshis to 75.9 Satoshis holds the key in the near future. A break above the same might open the doors for a move towards 95.0 Satoshis.
On the downside, the 100 hourly MA is an immediate support, followed by the all-important bullish trend line.
Intraday Support Level – 80.0 Satoshis
Intraday Resistance Level – 86.0 Satoshis
The hourly RSI is above the 50 level, which means the risk of a move higher is more looking ahead.
Charts courtesy of Trading View