

Key Highlights
- Dogecoin price continued to struggle to move in one particular direction, as there were many false breaks noted.
- 0-60.0 Satoshis remains a major support area for buyers which is likely to act as a pivot area moving ahead.
Dogecoin price once spiked above 70.0 Satoshis and traded as high as 75.1 Satoshis, but failed to maintain gains.
The Dogecoin price range traded for some time as there was a monster support area formed around 62.0 Satoshis. Buyers finally managed to take the price higher and cleared the range resistance area. However, they failed miserably to maintain momentum, as the price moved back lower. The price was again back below 70.0 Satoshis, and was seen heading towards the most important support of 62.0 Satoshis. The Lower Bollinger Band is aligned around the stated support area, which points to the significance of the highlighted support area.
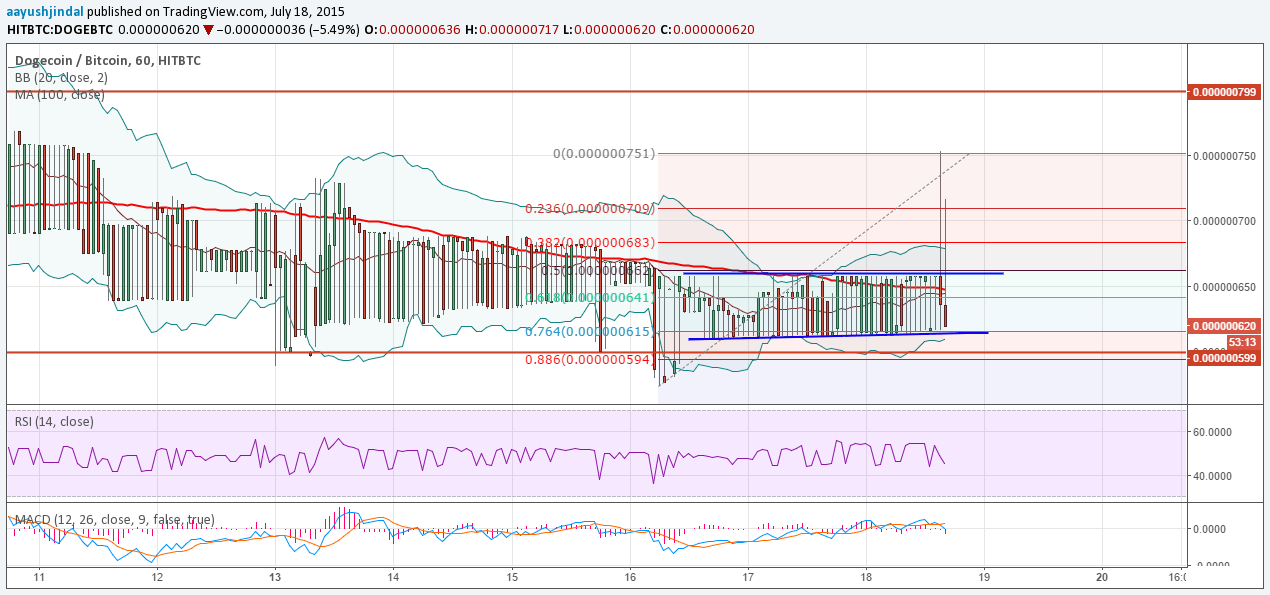
There was even a move above the 100 hourly simple moving average, but even then buyers failed to take the price further higher. The recent rejection is a warning sign, which poses a risk of a break lower in the near term. If sellers manage to break the 60.0 Satoshis support area, then a move towards 55.0 Satoshis is possible.
On the upside, the price needs a daily close above 70.0 Satoshis. If there is a daily close as mentioned, then the chance of a move higher towards 75.0 Satoshis might increase.
RSI and MACD
Both the RSI and MACD are sitting in the bearish territory, which signals more losses. One more important support is forming around 58.0 Satoshis, which might act as a hurdle for sellers.
Intraday Support Level – 62.0 Satoshis
Intraday Resistance Level – 70.0 Satoshis
Overall, we need to wait and see which way the price breaks, and then trade accordingly.
Charts courtesy of Trading View