

Polkadot’s DOT started a fresh increase from the $5.80 support against the US Dollar. The bulls seem to be aiming a strong breakout above $6.80 and $7.00.
- DOT is moving higher from the $6.00 and $6.20 levels against the US dollar.
- The price is trading above the $6.50 support and the 100 simple moving average (4-hours).
- There is a major bearish trend line forming with resistance near $6.70 on the 4-hours chart of the DOT/USD pair (data source from Kraken).
- The pair could start a strong surge once it clears the $6.80 and $7.00 resistance levels.
Polkadot’s DOT Price Eyes Upside Break
After forming a base above the $5.80 zone, DOT price started a fresh increase. It climbed above the $6.20 and $6.25 levels to move back into a positive zone, similar to bitcoin and ethereum.
The bulls were able to push the price above the $6.50 level and the 100 simple moving average (4-hours). Besides, the price climbed above the 50% Fib retracement level of the key decline from the $7.199 swing high to $5.88 low. DOT price is now trading above the $6.50 support and the 100 simple moving average (4-hours).
An immediate resistance is near the $6.70 level. There is also a major bearish trend line forming with resistance near $6.70 on the 4-hours chart of the DOT/USD pair.
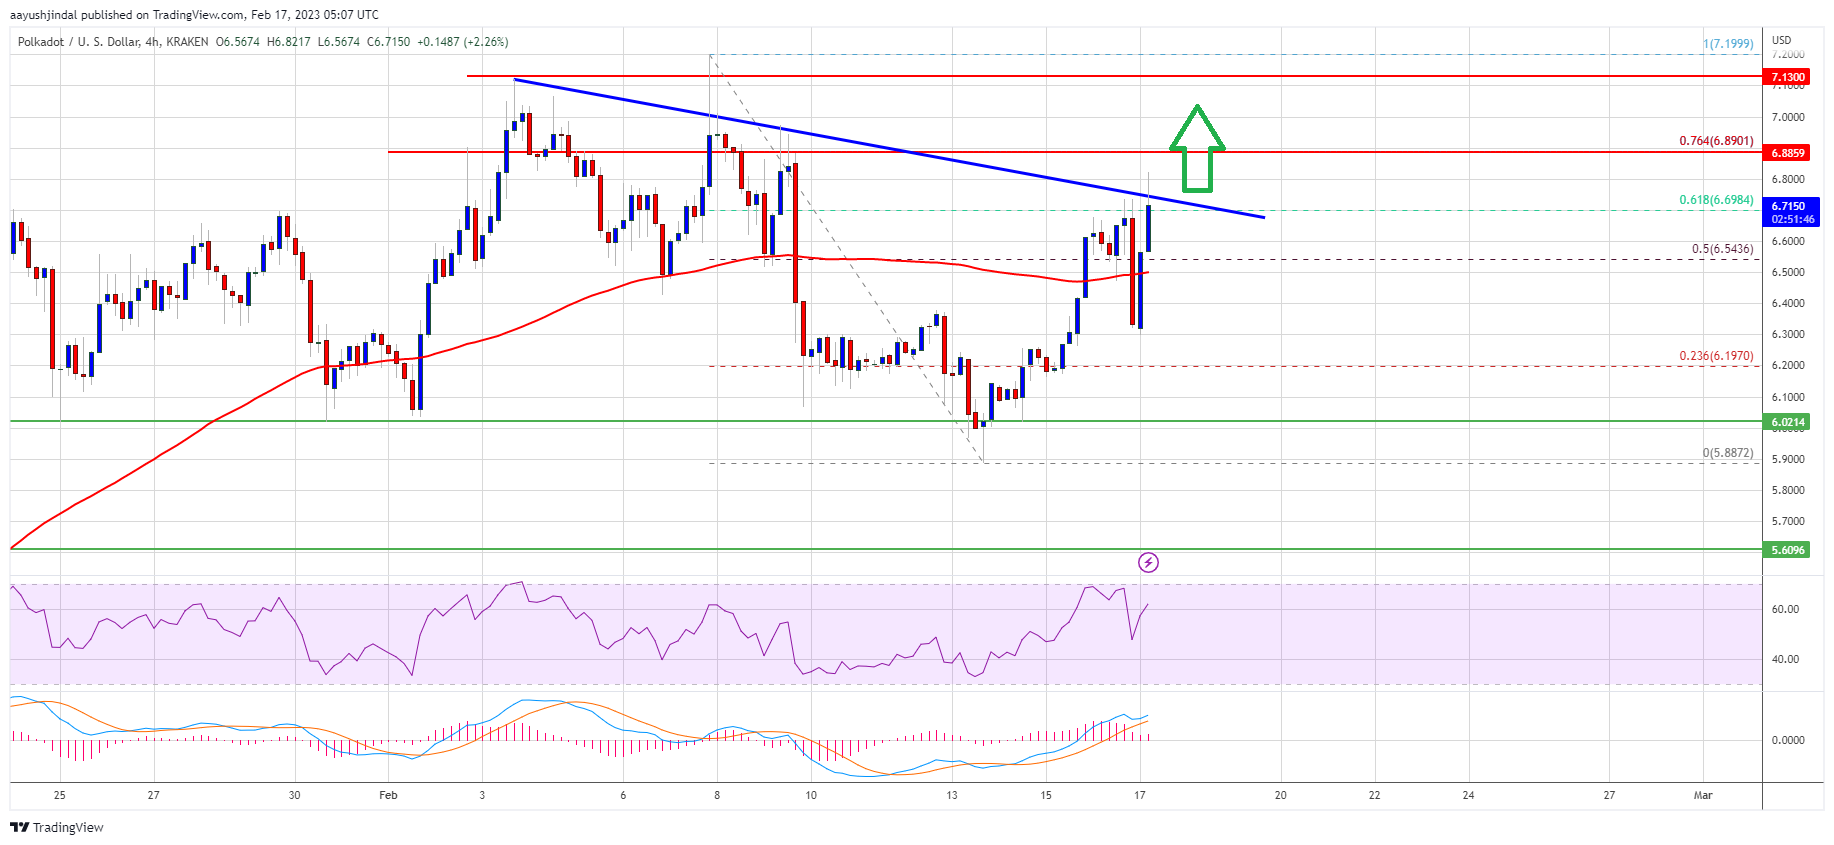
Source: DOTUSD on TradingView.com
The main resistance is near the $6.85 and $6.90 levels. It is close to the 76.4% Fib retracement level of the key decline from the $7.199 swing high to $5.88 low. A successful break above $6.90 and a close above $7.00 could start a strong rally. In the stated case, the price could easily rally towards $7.50 or even $7.65.
Dips Supported?
If DOT price fails to continue higher above $6.70 or $6.90, there could be a downside correction. The first key support is near the $6.50 level and the 100 simple moving average (4-hours).
The next major support is near the $6.35 level, below which the price might decline to $6.20. Any more losses may perhaps open the doors for a move towards the $6.00 support zone.
Technical Indicators
4-Hours MACD – The MACD for DOT/USD is now gaining momentum in the bullish zone.
4-Hours RSI (Relative Strength Index) – The RSI for DOT/USD is now above the 50 level.
Major Support Levels – $6.50, $6.35 and $6.00.
Major Resistance Levels – $6.70, $6.90 and $7.00.