

Over the previous two weeks, the Polkadot bulls had taken control of the market. DOT has risen by more than 21% in the last week. The coin started to lose value on the daily time frame and fell by nearly 3%. Since the beginning of this year, Polkadot has performed exceptionally well, logging close to 70% gains in the mentioned time frame.
Despite the daily price decline, the technical outlook for DOT is bullish. Buyers remained optimistic on the charts, which also reflected positively on both demand and accumulation for the altcoin. At the moment, the altcoin has been trading very close to its immediate resistance level, but there still happens to be another crucial ceiling for the altcoin to get past.
For Polkadot to clear its immediate price ceiling, DOT must retain its price momentum above the $7 support line.
As Bitcoin lost steam after touching the $25,000 price mark, the price movement of many altcoins was halted on their respective charts. The market capitalization of Polkadot noted a slight uptick, which meant that buyers were still dominant in the market.
Polkadot Price Analysis: One-Day Chart

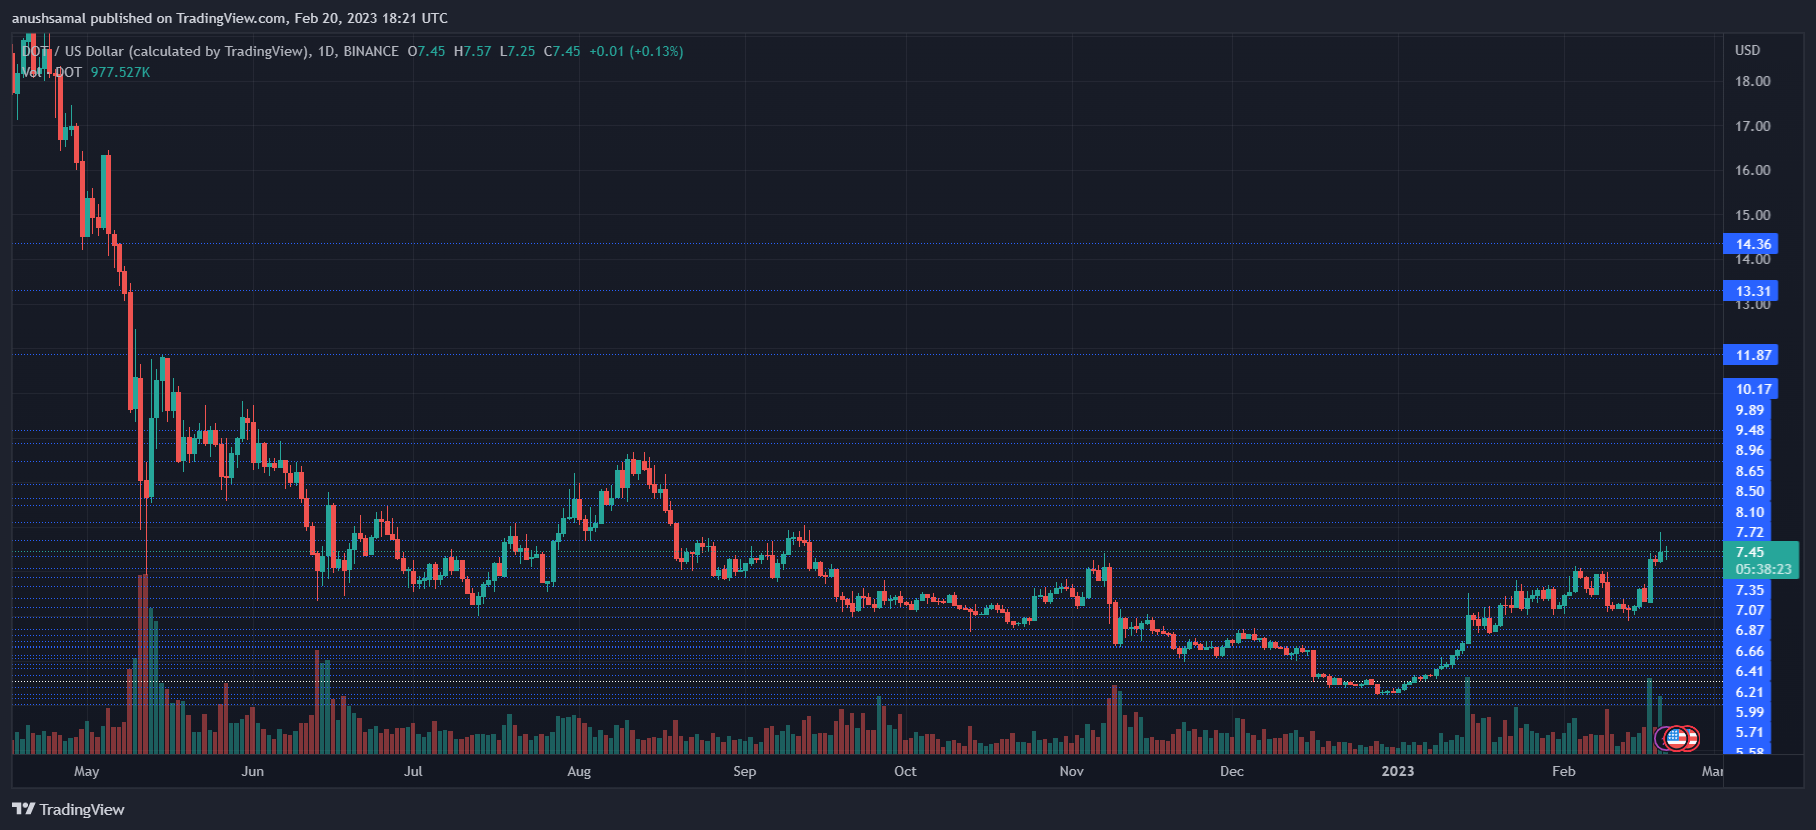
DOT was trading at $7.45 at press time. Since January, the coin has been trying to ensure the price moves north. When Polkadot broke past the $6 price zone, it also toppled above important resistance marks.
The immediate resistance for the altcoin was $8, a vital price. Polkadot last traded above the $8 price level several months ago.
The amount of Polkadot traded in the last session was green, indicating demand for the altcoin. Even with increased demand, DOT must clear the $7.72 price level to trade at $8 or go above it. On the other hand, a price correction will bring DOT to $6.87 and then to $6.41.
Technical Analysis

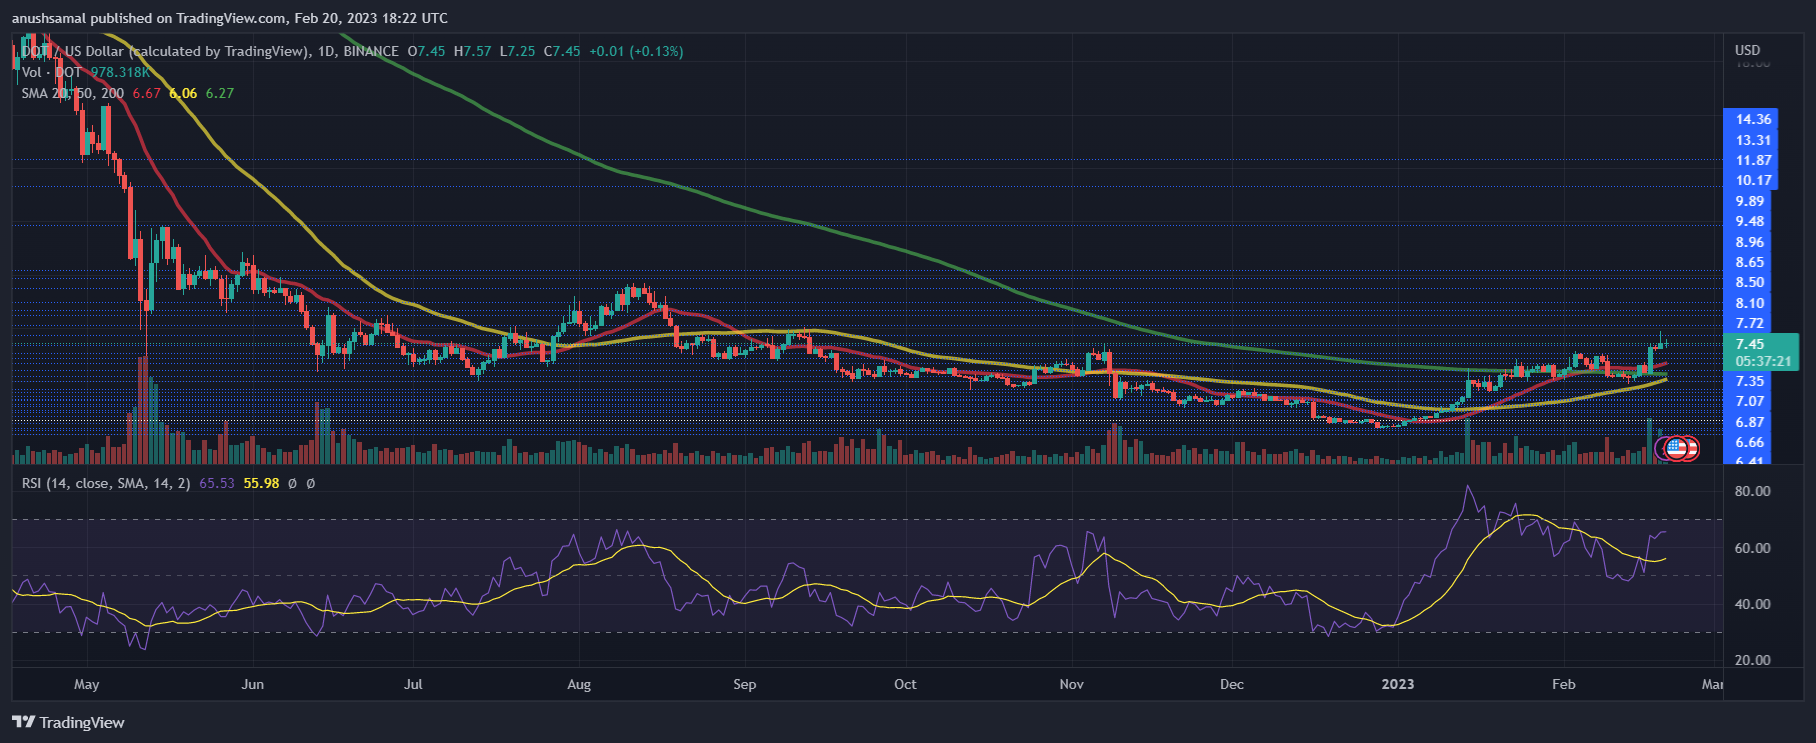
DOT retraced from the overbought zone over the past few weeks but noted an increase in buying strength at the time of writing. The Relative Strength Index moved above the 60-mark and was nearing the overvalued zone.
This depicted increased buying pressure, which could help the altcoin cross the $7.70 level. On the same note, Polkadot moved above the 20-Simple Moving Average line (SMA) as buyers continued to drive the price momentum. Continued buying momentum can push Polkadot above the $8 mark.
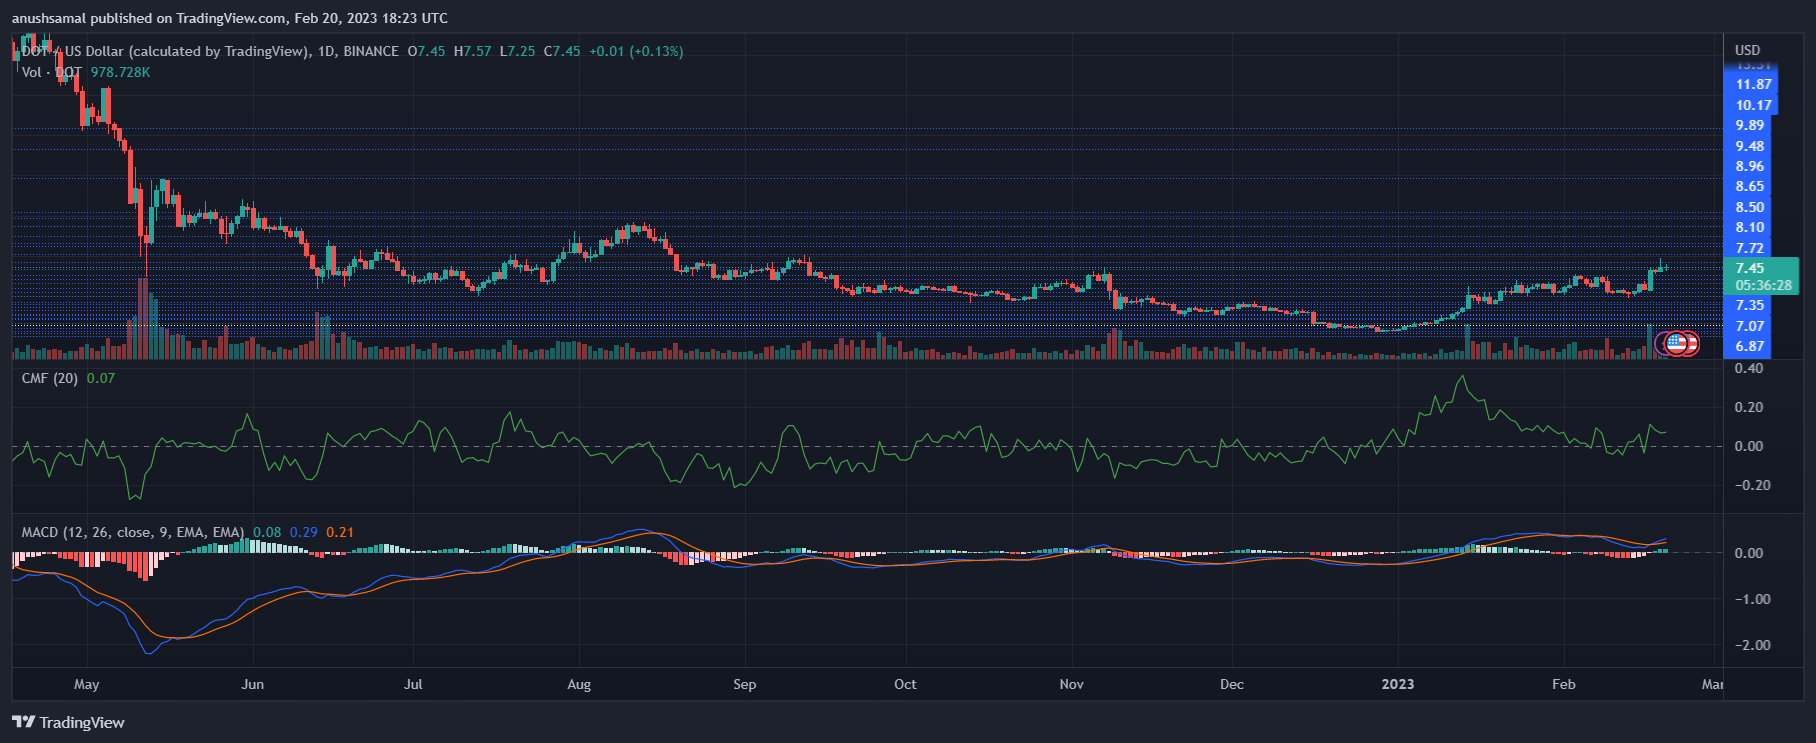
Other critical technical indicators have also pointed towards the coin attempting to rise on its chart over the subsequent trading sessions. The Moving Average Convergence Divergence depicts the price momentum. The indicator formed green signal bars that corresponded to altcoin buy signals.
The Chaikin Money Flow is responsible for calculating capital inflows and outflows. The indicator was placed above the half-line, indicating that capital inflows were more significant in amount than capital outflows.