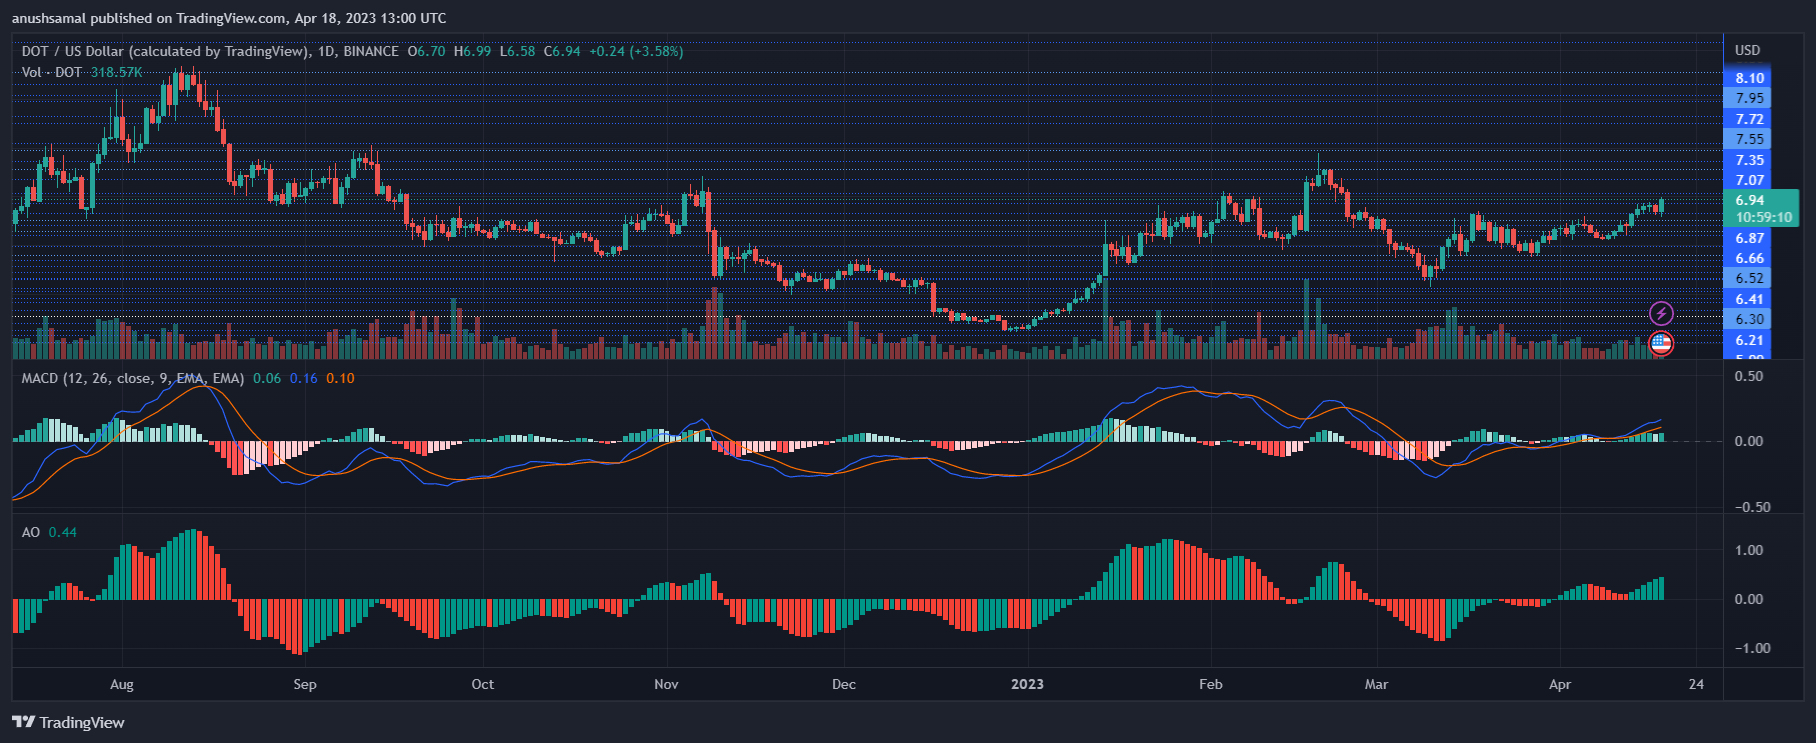
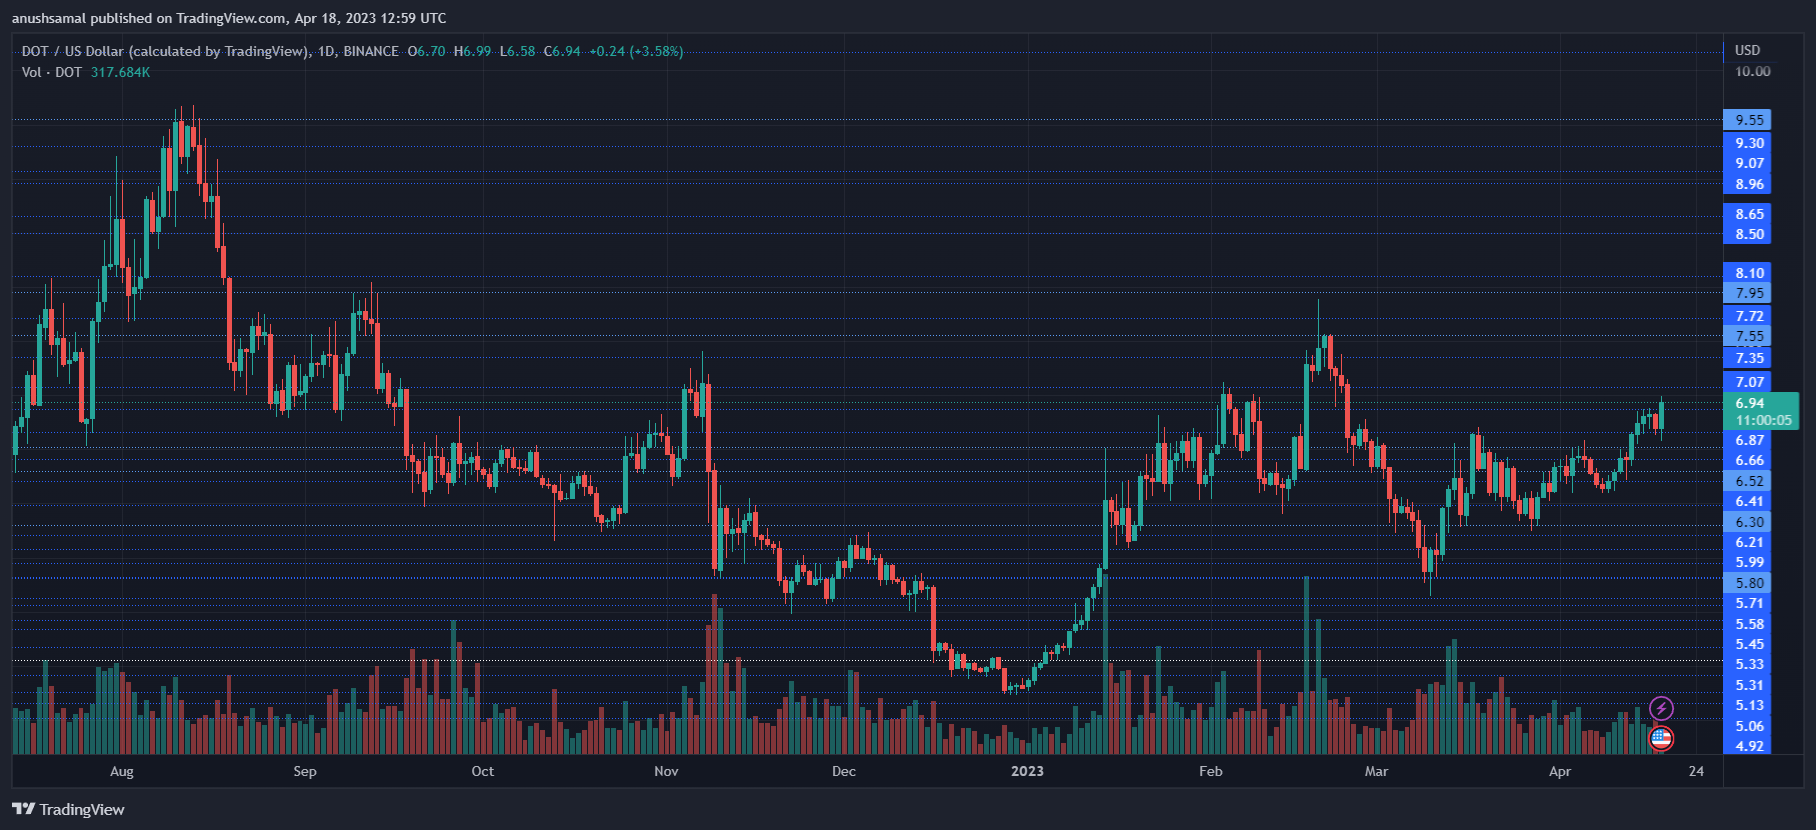
Polkadot has displayed significant recovery in the past week, with a 10% increase in its price. On the daily chart, the altcoin noted a 4% increase. During this time, DOT was consolidating between $5.40 and $6.40, but once it breached the $6.40 mark, its price started to move north.
Currently, Polkadot is hovering just below the psychological barrier of $7. If it manages to move above this level, it will face another crucial resistance mark, which, if surpassed, can potentially lead to a rally in its price.
The technical outlook for Polkadot is bullish, indicating that the altcoin has the potential to move higher. Additionally, there has been a recovery in demand over the past few days, and accumulation has been high, which is a positive sign for the altcoin’s price. The market capitalization of DOT has also increased, which indicates that there is a higher demand for the altcoin.
However, bullish sentiment for DOT is largely dependent on the broader market strength and Bitcoin’s movement above $30,000. Bitcoin’s movement can have a positive impact on the altcoin market, which can lead to an increase in the DOT price.
Polkadot Price Analysis: One-Day Chart

At the time of writing, DOT was trading at $6.90, having taken a bullish turn after breaking past the $6.60 mark. The next overhead resistance is at $7, followed by a crucial resistance at $7.60, which marks a bearish order block characterized by an influx of sellers.
On the downside, support for the altcoin stands at $6.50. A further decline can bring the price to $6.30. The trading volume of Polkadot in the last session was green, indicating positive demand for the altcoin. However, breaching the resistance levels will be crucial for DOT to continue its bullish run.
Technical Analysis

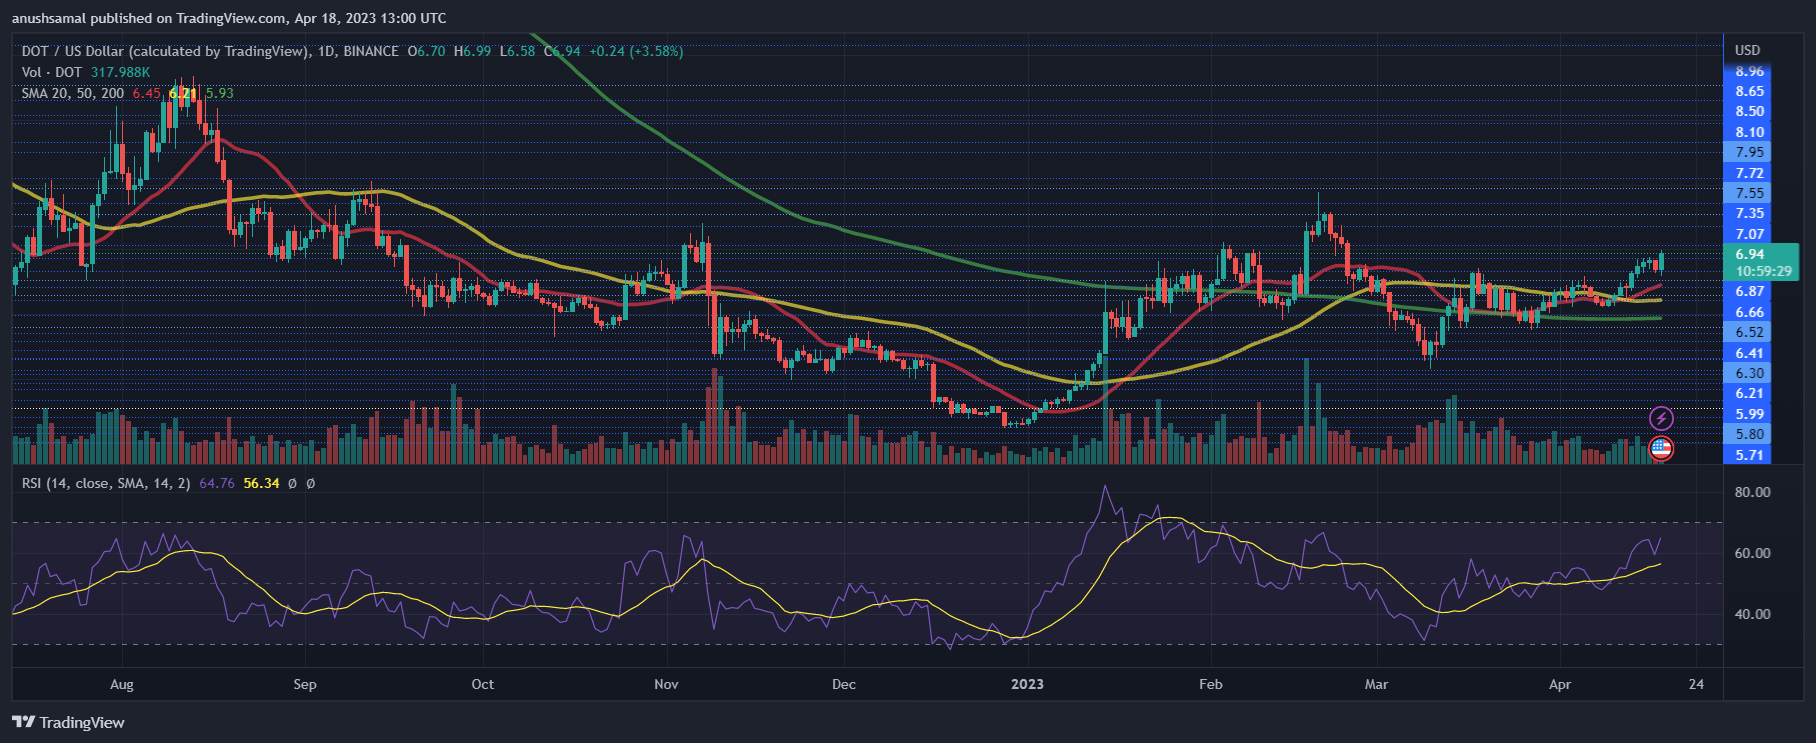
The altcoin witnessed a notable increase in buying strength, with a sharp u-turn in demand. At the time of writing, the Relative Strength Index was above 60, indicating that buyers had overtaken sellers.
This was further supported by the price of the asset moving above the 20-Simple Moving Average line, suggesting that buyers were driving the price momentum in the market. This indicated that investors were bullish on the altcoin, and it may continue to rise in the near future.