
Reason to trust
How Our News is Made
Strict editorial policy that focuses on accuracy, relevance, and impartiality
Ad discliamer
Morbi pretium leo et nisl aliquam mollis. Quisque arcu lorem, ultricies quis pellentesque nec, ullamcorper eu odio.
Ethereum staged a strong increase and climbed above the $370 resistance against the US Dollar. ETH price is currently consolidating gains and it could correct lower.
- Ethereum started a decent increase above the $355, $365 and $370 resistance levels.
- The price is now well above $365 and the 100 hourly simple moving average.
- There is a short-term bullish trend line forming with support near $372 on the hourly chart of ETH/USD (data feed via Kraken).
- The pair could correct lower, but dips are likely to remain contained near $365 or $355.
Ethereum Price Consolidating Gains
Ethereum started a fresh increase after it broke the key $355 resistance level (similar to bitcoin at $11,000). ETH price surpassed the $365 and $370 resistance levels to move into a positive zone.
There was also a close above the $370 level and ether price settled well above the 100 hourly simple moving average. A new monthly high is formed near $379 and the price is currently consolidating gains.
It corrected lower below the $372 level, plus the 23.6% Fib retracement level of the upward move from the $347 swing low to $379 high. However, the price remained well bid above the $365 support and it climbed back above $370.
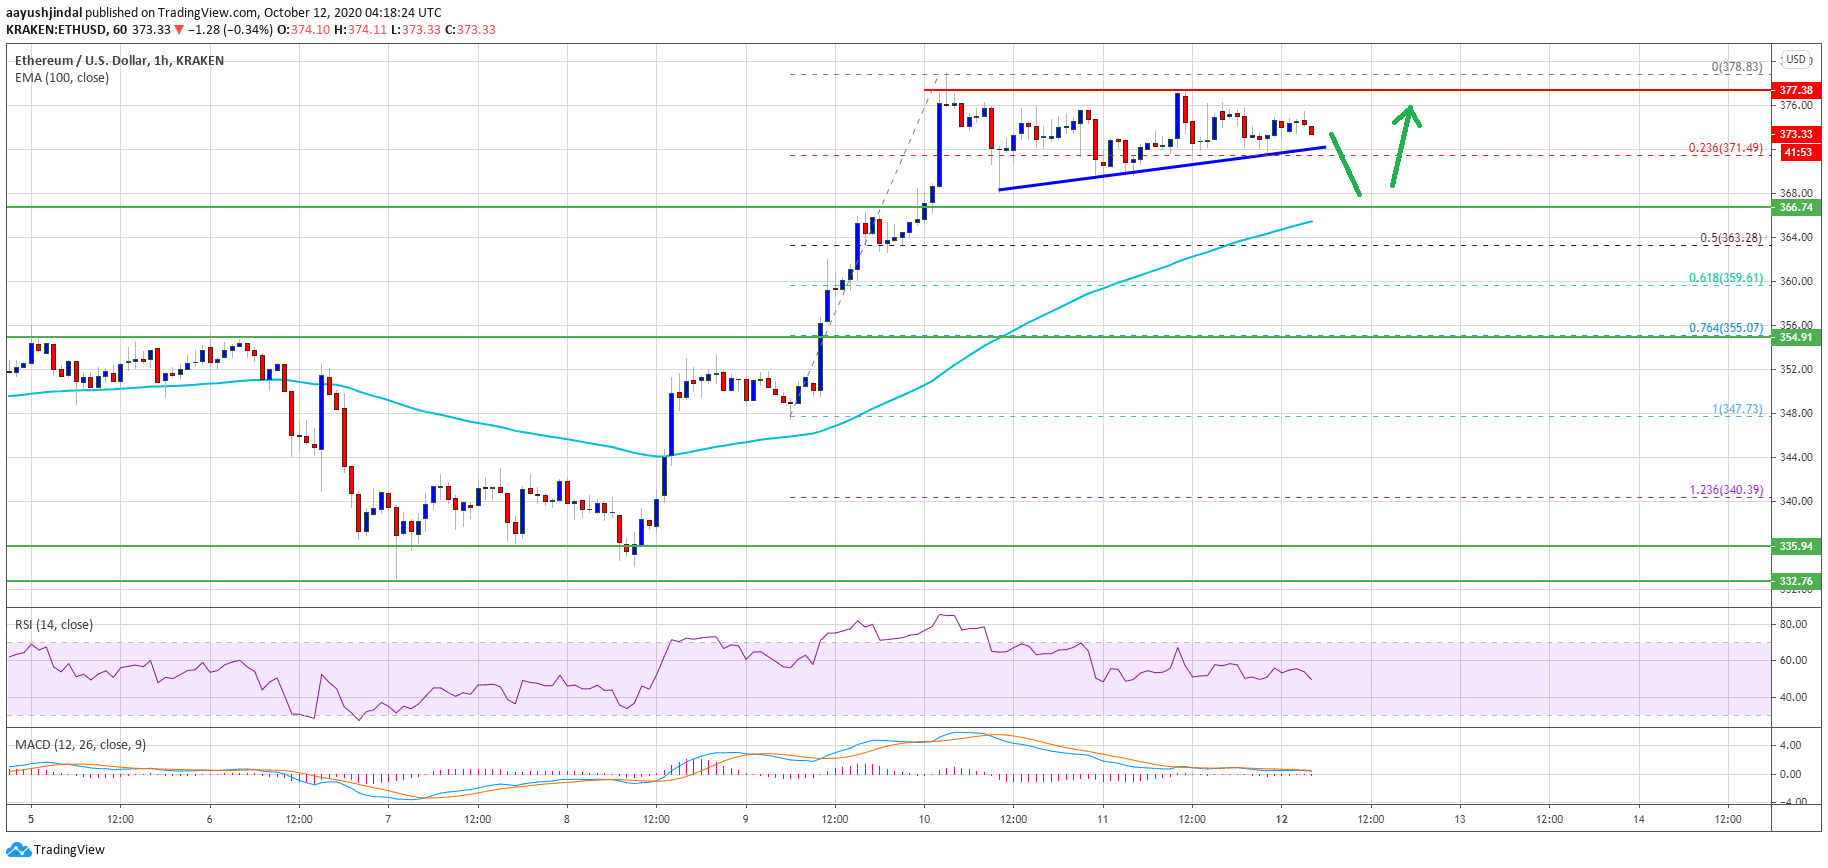
Ethereum price settles above $365. Source: TradingView.com
There was also no break below the 50% Fib retracement level of the upward move from the $347 swing low to $379 high. It seems like there is a short-term bullish trend line forming with support near $372 on the hourly chart of ETH/USD.
On the upside, an initial resistance is near the $378 and $380 levels. A clear break above the $380 resistance level could open the doors for another increase. The next major resistance is near the $395 and $400 levels.
Dips Limited in ETH?
If Ethereum fails to clear the $378 resistance or $380, there could be a downside correction. A downside break below the trend line support could lead the price towards the $365 support level.
The 100 hourly simple moving average is also near the $365 level. Any further losses could lead ether price towards the main support at $355 (the last breakout resistance), where the bulls are likely to take a strong stand.
Technical Indicators
Hourly MACD – The MACD for ETH/USD is slowly losing momentum in the bullish zone.
Hourly RSI – The RSI for ETH/USD is currently holding the 50 level, with a few bearish signs.
Major Support Level – $365
Major Resistance Level – $380


