
Reason to trust
How Our News is Made
Strict editorial policy that focuses on accuracy, relevance, and impartiality
Ad discliamer
Morbi pretium leo et nisl aliquam mollis. Quisque arcu lorem, ultricies quis pellentesque nec, ullamcorper eu odio.
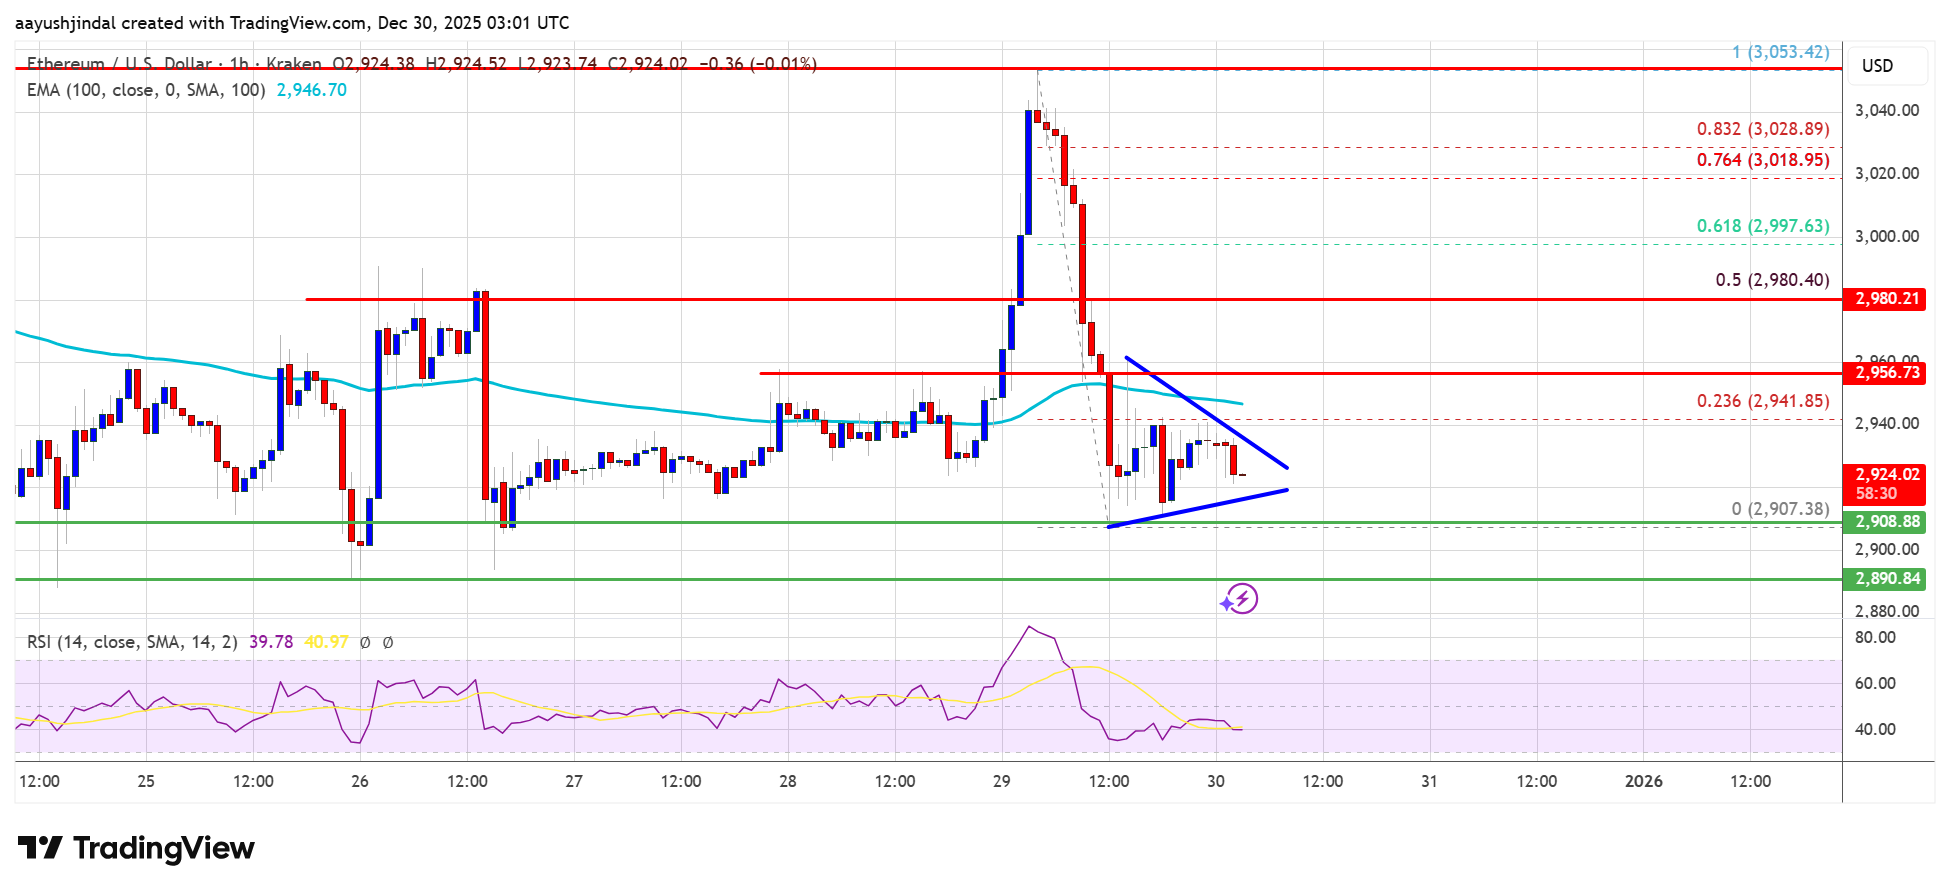
Ethereum price started a decent upward move but failed near $3,050. ETH is now struggling and might continue to move down below $2,900.
- Ethereum started a recovery wave but struggled above $3,000.
- The price is trading below $2,950 and the 100-hourly Simple Moving Average.
- There is a short-term contracting triangle forming with resistance at $2,930 on the hourly chart of ETH/USD (data feed via Kraken).
- The pair could continue to move down if it breaks below the $2,880 zone.
Ethereum Price Dips Again
Ethereum price started a recovery wave above the $2,920 and $2,950 levels, like Bitcoin. ETH price even climbed above the $3,000 resistance before the bears appeared.
A high was formed at $3,053, and the price started another decline. There was a sharp decline below $3,000 and $2,980. The bears even pushed the price below $2,950. A low was formed at $2,907 and the price is now consolidating losses below the 23.6% Fib retracement level of the downward move from the $3,053 swing high to the $2,907 low.
Ethereum price is now trading above $2,950 and the 100-hourly Simple Moving Average. If the bulls are able to protect more losses below $2,900, the price could attempt another recovery wave.
Immediate resistance is seen near the $2,940 level. Besides, there is a short-term contracting triangle forming with resistance at $2,930 on the hourly chart of ETH/USD. The first key resistance is near the $2,955 level. The next major resistance is near the $2,980 level. It is close to the 50% Fib retracement level of the downward move from the $3,053 swing high to the $2,907 low.
A clear move above the $2,950 resistance might send the price toward the $3,000 resistance. An upside break above the $3,000 region might call for more gains in the coming days. In the stated case, Ether could rise toward the $3,050 resistance zone or even $3,120 in the near term.
Another Decline In ETH?
If Ethereum fails to clear the $2,955 resistance, it could start a fresh decline. Initial support on the downside is near the $2,900 level.
The first major support sits near the $2,880 zone. A clear move below the $2,880 support might push the price toward the $2,840 support. Any more losses might send the price toward the $2,800 region. The next key support sits at $2,720.
Technical Indicators
Hourly MACD – The MACD for ETH/USD is gaining momentum in the bearish zone.
Hourly RSI – The RSI for ETH/USD is now below the 50 zone.
Major Support Level – $2,900
Major Resistance Level – $2,955


