
Reason to trust
How Our News is Made
Strict editorial policy that focuses on accuracy, relevance, and impartiality
Ad discliamer
Morbi pretium leo et nisl aliquam mollis. Quisque arcu lorem, ultricies quis pellentesque nec, ullamcorper eu odio.
Ethereum price started a fresh increase and tested $2,200. ETH is now correcting gains and might decline further if it trades below $2,030.
- Ethereum started a downside correction below the $2,120 zone.
- The price is trading above $2,065 and the 100-hourly Simple Moving Average.
- There is a key bullish trend line forming with support at $2,030 on the hourly chart of ETH/USD (data feed via Kraken).
- The pair could start a fresh decline if it stays below the $2,135 zone.
Ethereum Price Starts Downside Correction
Ethereum price started a fresh increase above the $2,065 resistance, like Bitcoin. ETH price rallied above the $2,120 and $2,150 resistance levels.
The bulls even pumped the price above $2,180. A high was formed at $2,200 before there was a downside correction. The price dipped below $2,120 and tested the 50% Fib retracement level of the upward move from the $1,929 swing low to the $2,200 high.
Ethereum price is now trading above $2,065 and the 100-hourly Simple Moving Average. There is also a key bullish trend line forming with support at $2,030 on the hourly chart of ETH/USD.
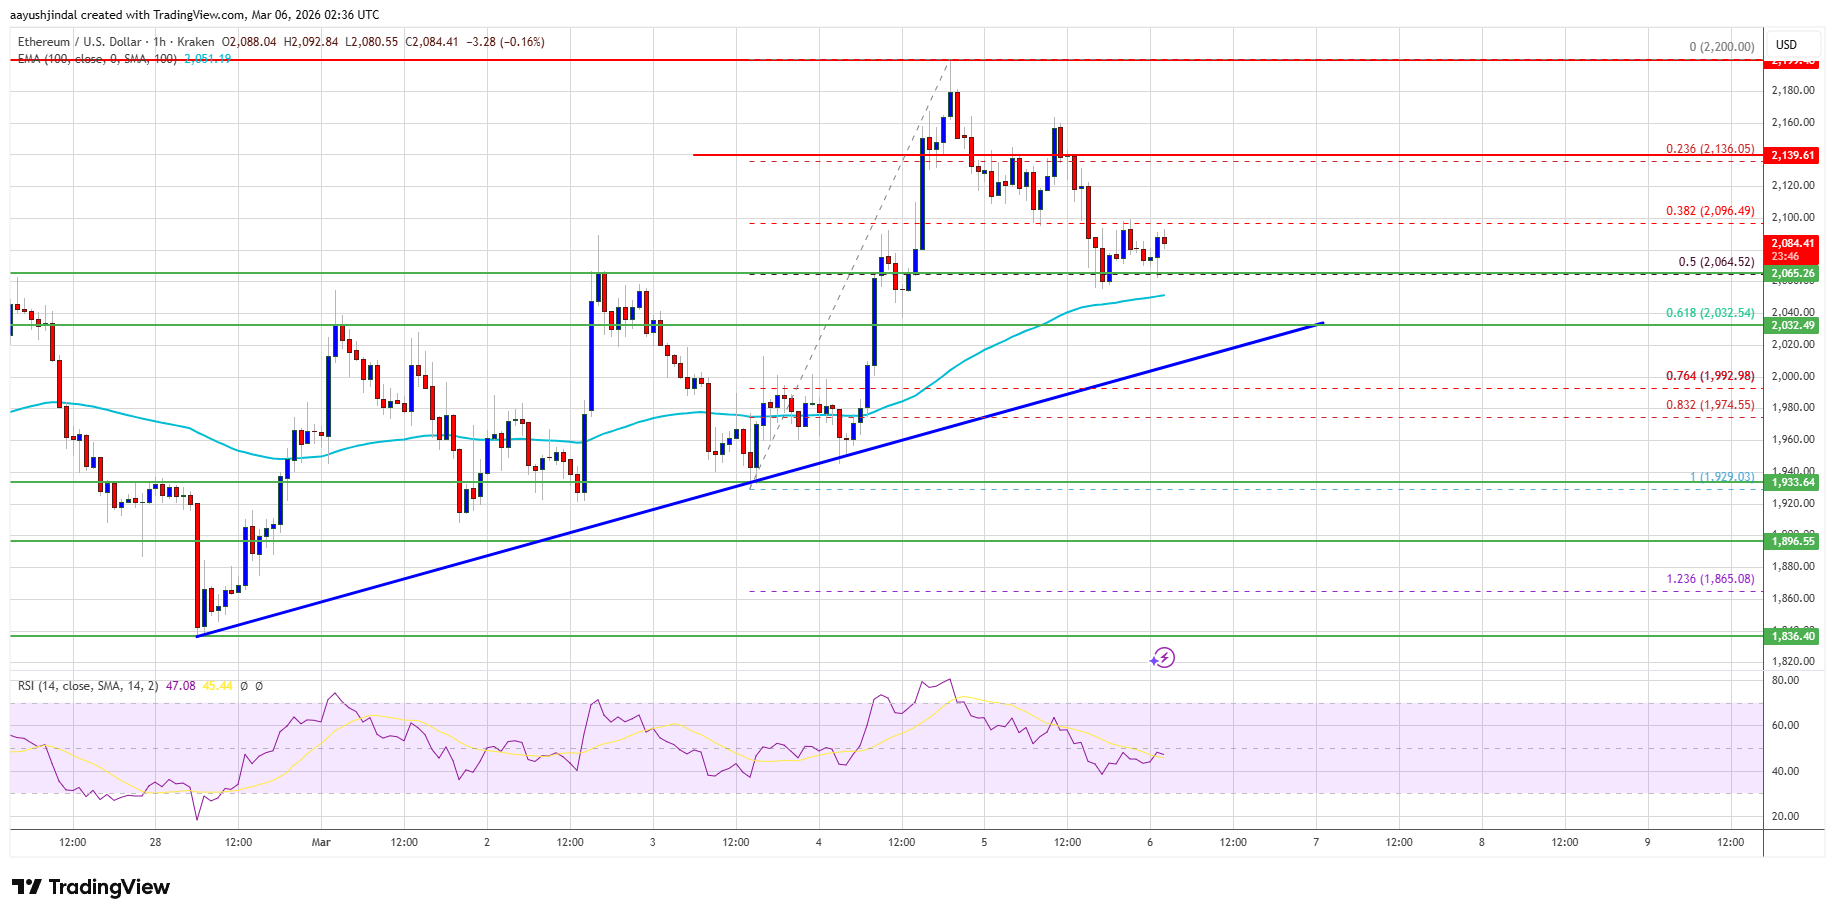
If the bulls remain in action above $2,030, the price could attempt another increase. Immediate resistance is seen near the $2,100 level. The first key resistance is near the $2,135 level. The next major resistance is near the $2,150 level. A clear move above the $2,150 resistance might send the price toward the $2,200 resistance. An upside break above the $2,200 region might call for more gains in the coming days. In the stated case, Ether could rise toward the $2,250 resistance zone or even $2,320 in the near term.
More Losses In ETH?
If Ethereum fails to clear the $2,135 resistance, it could start a fresh decline. Initial support on the downside is near the $2,065 level. The first major support sits near the $2,030 zone, the trend line, and the 61.8% Fib retracement level of the upward move from the $1,929 swing low to the $2,200 high.
A clear move below the $2,030 support might push the price toward the $2,000 support. Any more losses might send the price toward the $1,965 region. The main support could be $1,920.
Technical Indicators
Hourly MACD – The MACD for ETH/USD is losing momentum in the bullish zone.
Hourly RSI – The RSI for ETH/USD is now below the 50 zone.
Major Support Level – $2,030
Major Resistance Level – $2,135


