Key Highlights
- Ethereum classic price declined below $15.00 recently and failed to gain momentum against the US Dollar.
- There is a major bearish trend line with resistance near $14.80-15.00 forming on the hourly chart of ETC/USD (Data feed via Kraken).
- The $15.00 resistance is also near the 100 hourly simple moving average, which is a crucial hurdle for buyers.
Ethereum classic price is struggling and range trading versus the US Dollar and Bitcoin. ETC/USD has to clear $15.00 for an upside move.
Ethereum Classic Price Upside Hurdle
Recently, we saw a major downside break below $16.00 in ETC price against the US Dollar. The price traded towards the $13.50 level where it found support and later started a recovery. It someone managed to move above the 23.6% Fib retracement level of the last decline from the $17.60 high to $13.41 low. However, there was no convincing break above $14.50, which is not a good sign. It seems like the price is consolidating below the $15.00 resistance and preparing for the next move.
On the upside, there is a major bearish trend line with resistance near $14.80-15.00 forming on the hourly chart of ETC/USD. The trend line resistance coincides with the 38.2% Fib retracement level of the last decline from the $17.60 high to $13.41 low. Furthermore, the 100 hourly simple moving average is also near $15.00. Overall, it seems like the $15.00 level is a major resistance for an upside break for ETC. A close above the 100 hourly simple moving average could open the doors for a test of the $16.50 hurdle.
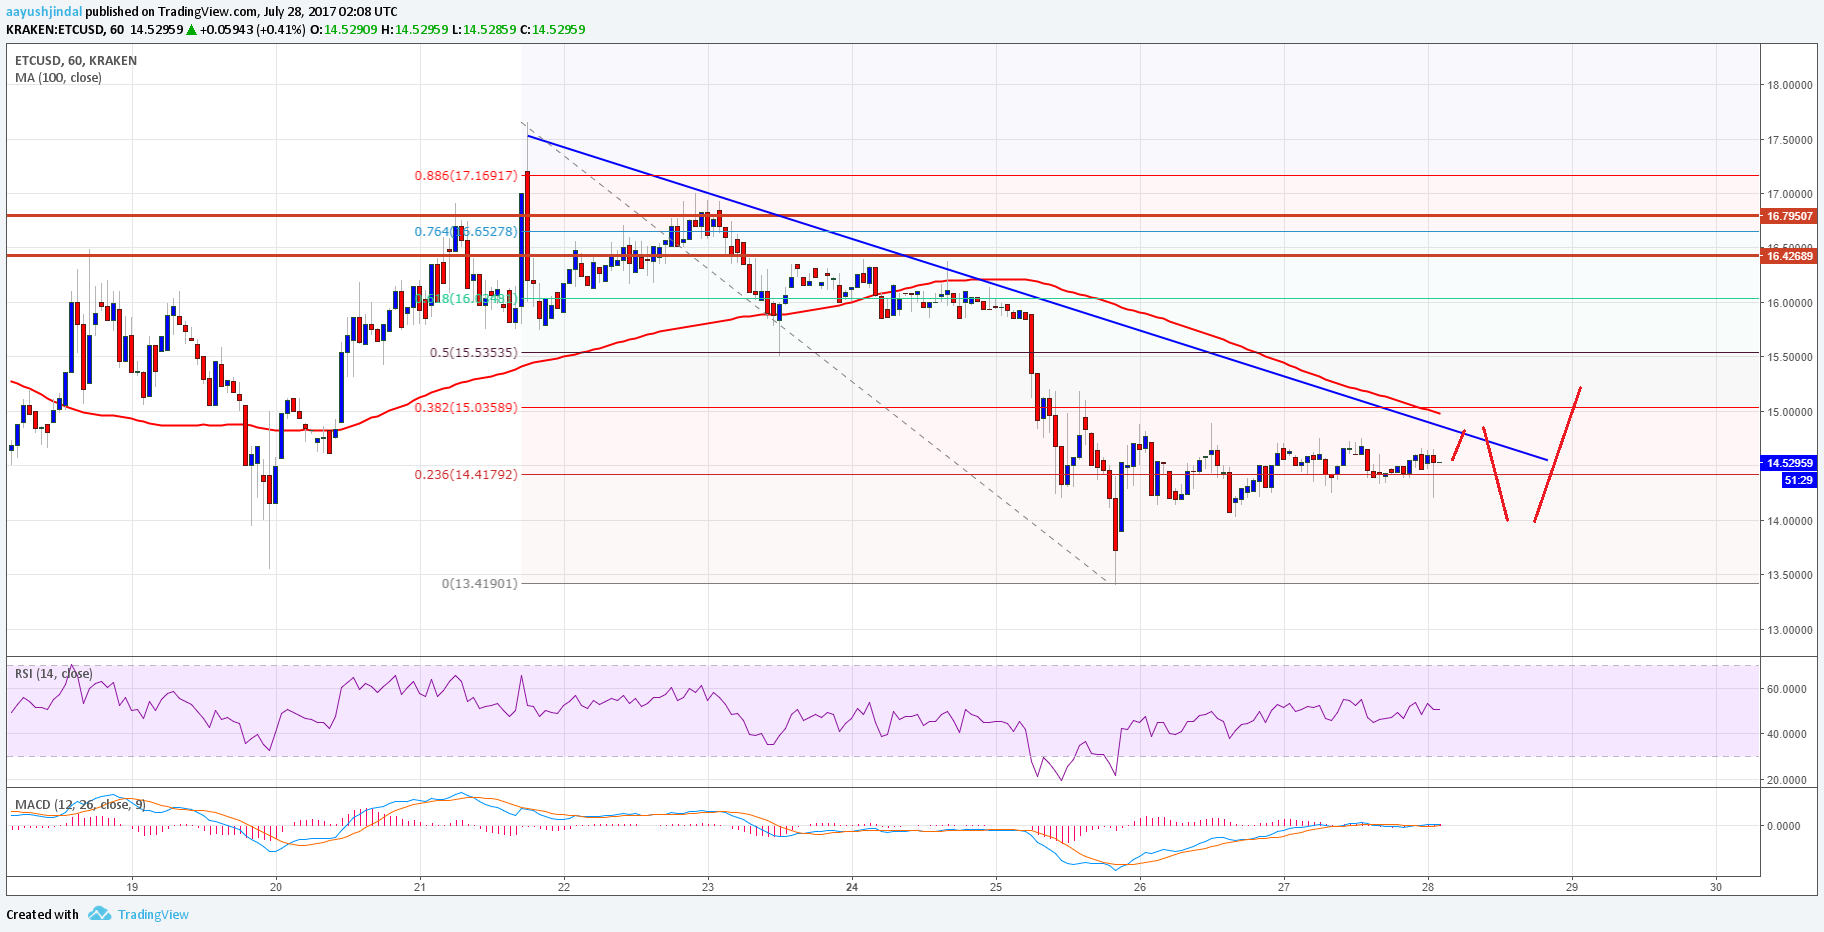
On the downside, the $14.00 level is a decent support. In short, we can see ranging moves before the price attempts an upside break.
Hourly MACD – The MACD is almost flat in the bearish zone.
Hourly RSI – The RSI is currently just around the 50 level.
Major Support Level – $14.00
Major Resistance Level – $15.50
Charts courtesy – Trading View, Kraken