

- ETH price topped near the $280 level and recently started a downside correction against the US Dollar.
- The price is slowly moving lower towards a couple of important supports near $265.
- Yesterday’s highlighted key ascending channel is intact with support near $266 on the hourly chart of ETH/USD (data feed via Kraken).
- The pair is likely to find a strong buying interest near the $266 and $265 support levels.
Ethereum price is currently correcting recent gains versus the US Dollar, but declining vs bitcoin. ETH could bounce back as long as it is trading above $265 and the 100 hourly SMA.
Ethereum Price Analysis
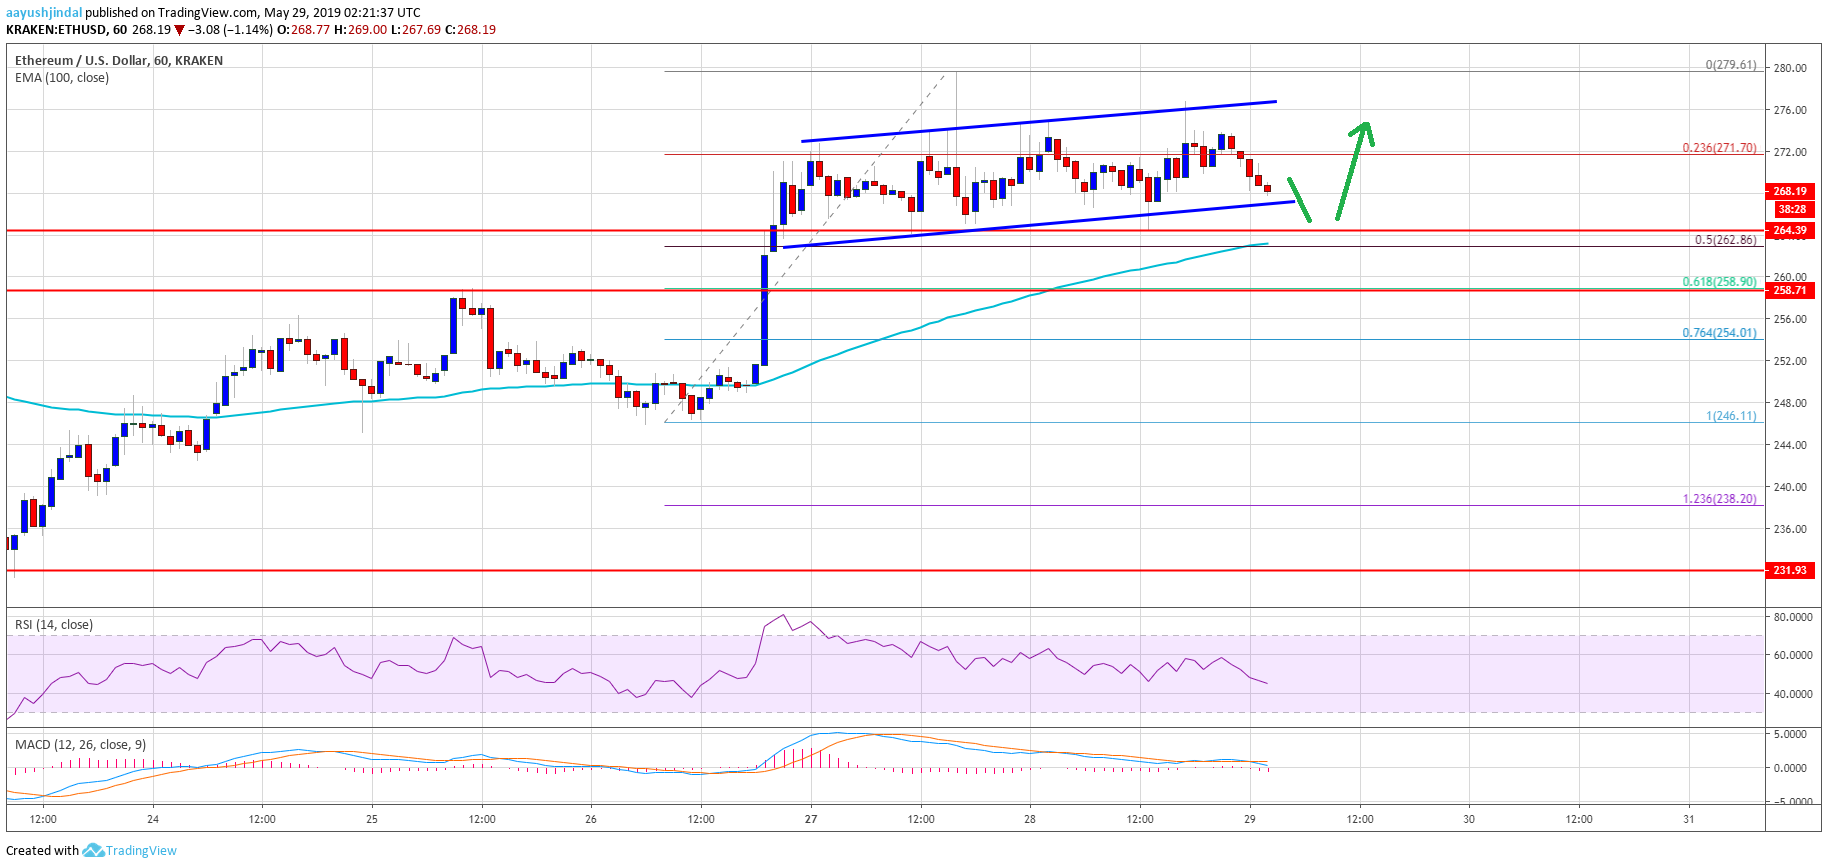
After a strong upward move, Ethereum price failed to clear the $280 resistance against the US Dollar. The ETH/USD pair formed a new weekly high near the $280 level and recently started a downside correction. It traded below the $275 and $272 support levels. Besides, there was a push below the 23.6% Fib retracement level of the last leg from the $246 low to $280 swing high. However, the price remains supported above the $265 and $262 levels.
Moreover, yesterday’s highlighted key ascending channel is intact with support near $266 on the hourly chart of ETH/USD. The previous resistance area near the $264-265 is likely to act as a strong support zone for the bulls. The next key support is near the $262 zone. It represents the 50% Fib retracement level of the last leg from the $246 low to $280 swing high. Finally, the 100 hourly simple moving average is also near the $262 level to act as a strong support. Therefore, there are many important support levels near $265 and $262.
As long as the price is holding the $262 support, it is likely to bounce back above $270 and $275. The main hurdle remains $280, above which the price could start a solid upward move towards the $295 and $300 levels. An immediate resistance is near $275 and the channel trend line. Once there is a break above $276, the price could attempt to surpass $280 and $282.
Looking at the chart, Ethereum price is clearly correcting lower above the main $262 support area. If the bulls fail to defend the $262 support and the 100 hourly SMA, the price might extend losses. The next key support on the downside is near the $258 level, below which the price is likely to accelerate towards $252.
ETH Technical Indicators
Hourly MACD – The MACD for ETH/USD is slowly gaining momentum in the bearish zone, with negative signs.
Hourly RSI – The RSI for ETH/USD recently declined below the 50 level, with a bearish angle.
Major Support Level – $262
Major Resistance Level – $276