
Reason to trust
How Our News is Made
Strict editorial policy that focuses on accuracy, relevance, and impartiality
Ad discliamer
Morbi pretium leo et nisl aliquam mollis. Quisque arcu lorem, ultricies quis pellentesque nec, ullamcorper eu odio.
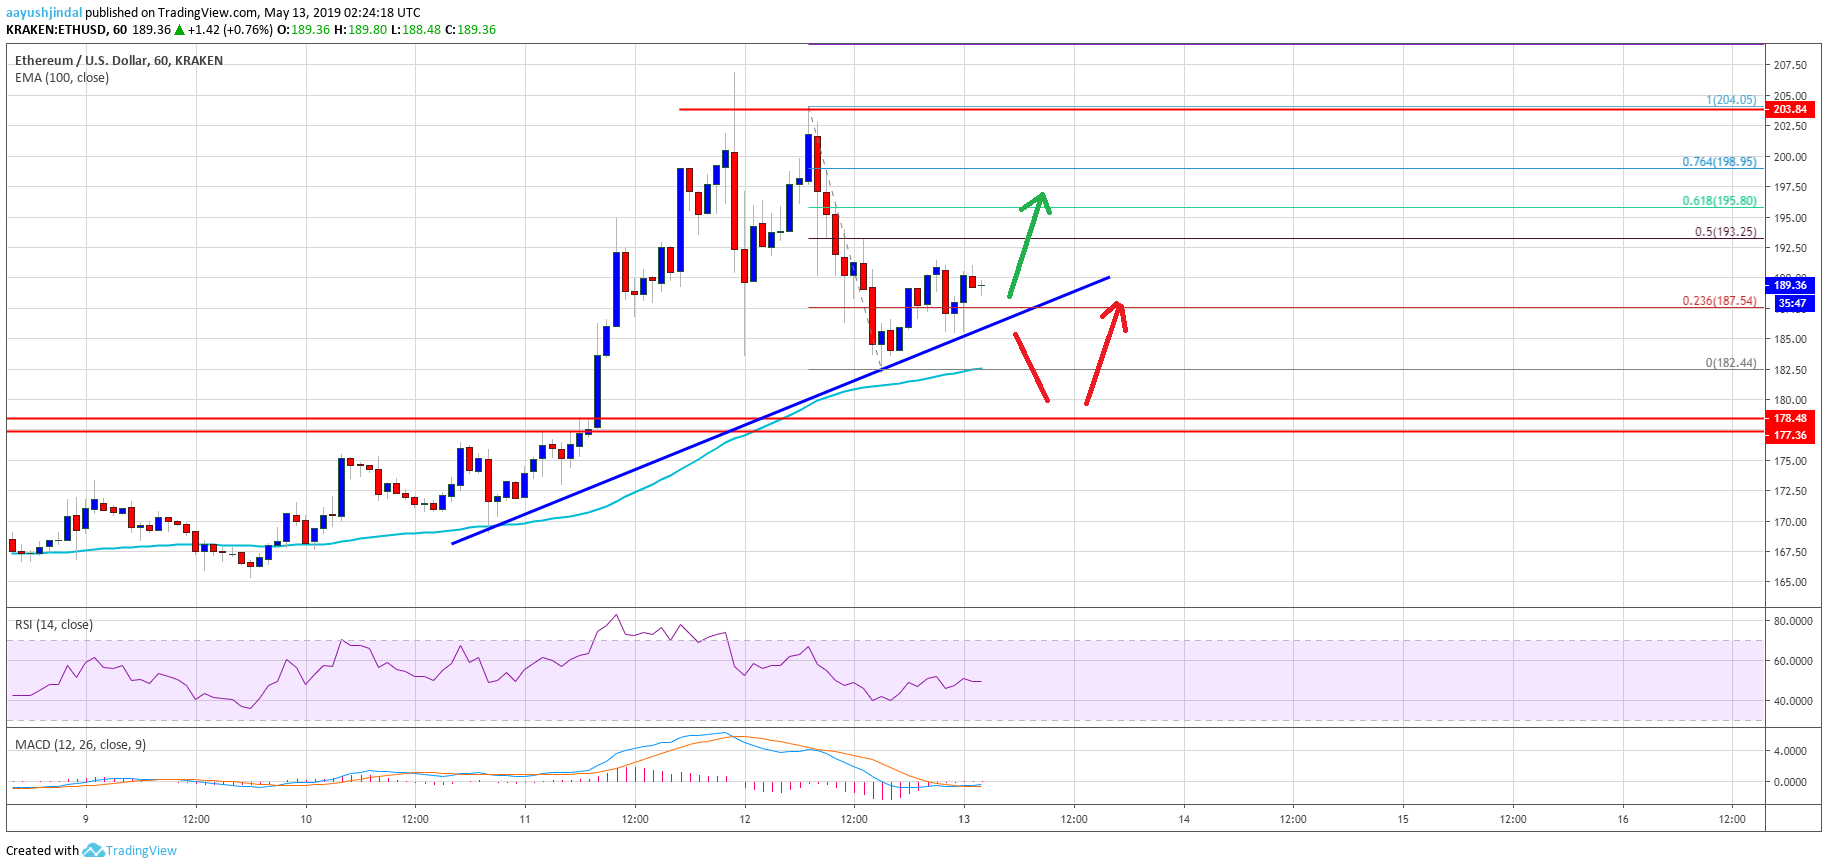
- ETH price climbed to a new 2019 high above $200 before correcting lower against the US Dollar.
- The price declined below the $195 and $190 support levels before the bulls appeared near $182.
- There is a new connecting bullish trend line forming with support near $186 on the hourly chart of ETH/USD (data feed via Kraken).
- The pair remains supported on dips and it seems like it could bounce back above $194.
Ethereum price started a downside correction versus the US Dollar, similar to bitcoin. ETH price remains well supported on the downside near $185 and $180.
Ethereum Price Analysis
In the past three days, there was a steady rise in Ethereum price above $180 resistance against the US Dollar. The ETH/USD pair followed bitcoin and broke a few important resistances near $190 and $195. There was even a break above the $200 barrier. The price traded close to the $208 level and settled well above the 100 hourly simple moving average. Recently, it started a downside correction and declined below the $195 and $190 support levels. The price even spiked below the $185 support and traded close to $182.
However, the price is trading well above the $180 support and the 100 hourly SMA. It has already recovered above the 23.6% Fib retracement level of the recent drop from the $204 swing high to $182 swing low. An immediate resistance on the upside is near the $193-194 zone. Besides, the 50% Fib retracement level of the recent drop from the $204 swing high to $182 swing low is also near $193. A successful break above the $194 level might set the pace for a fresh rise towards the $200 resistance area.
On the downside, an immediate support is near the $186 level. There is also a new connecting bullish trend line forming with support near $186 on the hourly chart of ETH/USD. If there is a downside break below the trend line, the price may test the 100 hourly SMA or the main support near $178.
Looking at the chart, Ethereum price seems to be correcting gains, but it remains well supported near $185 and $180. The key support is near the $178 level (the previous resistance). As long as the price is above the $178 support, it is likely bounce back. A fresh daily close above the $200 resistance is likely to trigger a strong rally in the coming sessions.
ETH Technical Indicators
Hourly MACD – The MACD for ETH/USD is about to move back in the bullish zone.
Hourly RSI – The RSI for ETH/USD is currently just below the 50 level, with a minor bearish angle.
Major Support Level – $180
Major Resistance Level – $194


