
Reason to trust
How Our News is Made
Strict editorial policy that focuses on accuracy, relevance, and impartiality
Ad discliamer
Morbi pretium leo et nisl aliquam mollis. Quisque arcu lorem, ultricies quis pellentesque nec, ullamcorper eu odio.
- ETH price traded further higher towards the $180 level before correcting lower against the US Dollar.
- The price dipped sharply below the $170 and $165 support levels to move into a short term bearish zone.
- Yesterday’s highlighted key bullish trend line was breached with support at $173 on the hourly chart of ETH/USD (data feed via Kraken).
- The pair found a strong buying interest near the $155 support and it is currently moving higher.
Ethereum price started a major downside correction after a massive upside versus the US Dollar and bitcoin. ETH is likely to bounce back above $170 as long as it is above $155.
Ethereum Price Analysis
In the past two days, we saw a massive rally in bitcoin and Ethereum against the US Dollar. The ETH/USD pair jumped above the $160 and $170 resistance levels. There was a proper close above the $165 level and the 100 hourly simple moving average. The price even climbed above the $175 level and traded towards the $180 level. A new yearly high was formed at $180 and later the price started a sharp downside correction.
There was a sharp dip below the $175, $170 and $168 support levels. The price even broke the key $165 support area to enter a short term bearish zone. Moreover, yesterday’s highlighted key bullish trend line was breached with support at $173 on the hourly chart of ETH/USD. The pair tested the $155 support area and the 100 hourly simple moving average. A strong buying interest emerged and a swing low was formed near $154. Later, the price bounced back above $160 and the 23.6% Fib retracement level of the recent drop from the $180 high to $154 low.
However, the price is currently facing a strong resistance near the $165 level. The stated $165 level was a support earlier and now it is preventing gains. The next resistance is near the $167 level. It represents the 50% Fib retracement level of the recent drop from the $180 high to $154 low.
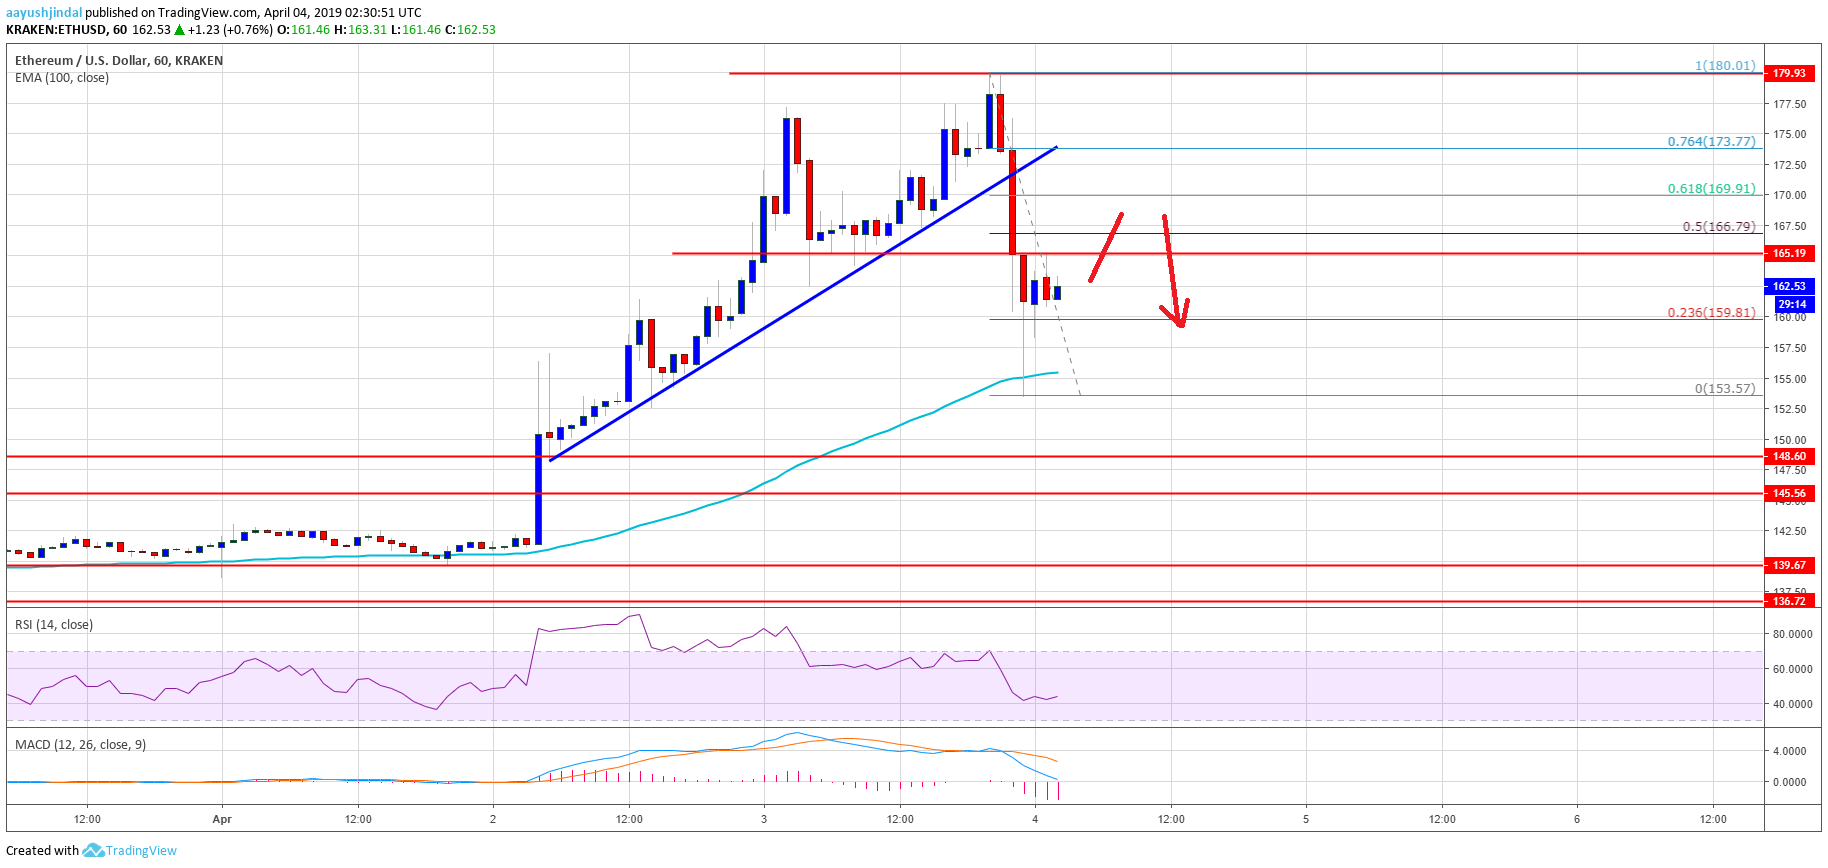
Looking at the chart, Ethereum price could gain traction above the $165 level and it could test the $167 or $170 resistance level. Later, there could be a fresh drop towards the $158 zone, where buyers are likely to appear. As long as Ether is trading above the $155 support and the 100 hourly SMA, it is likely to resume its upward move in the near term.
ETH Technical Indicators
Hourly MACD – The MACD for ETH/USD is currently placed heavily in the bearish zone.
Hourly RSI – The RSI for ETH/USD dipped sharply below the 50 level and it is currently near the 42 level.
Major Support Level – $155
Major Resistance Level – $170