Reason to trust
How Our News is Made
Strict editorial policy that focuses on accuracy, relevance, and impartiality
Ad discliamer
Morbi pretium leo et nisl aliquam mollis. Quisque arcu lorem, ultricies quis pellentesque nec, ullamcorper eu odio.
- ETH price rebounded nicely and traded above the $240 and $250 resistances against the US Dollar.
- The price tested the $265 level and it is currently correcting lower towards the $240 support.
- There is a key bullish trend line forming with support near $240 on the hourly chart of ETH/USD (data feed via Kraken).
- The pair is likely to find a strong buying interest near $240 and the 100 hourly simple moving average.
Ethereum price remains in a strong uptrend above $240 versus the US Dollar, but consolidating vs bitcoin. ETH is currently correcting lower, but dips remains supported near $240.
Ethereum Price Analysis
After forming a decent support base, Ethereum price rebounded nicely and traded above the $240 and $250 resistances against the US Dollar. The ETH/USD pair even cleared the $260 level and settled well above the 100 hourly simple moving average. A swing high was formed near $265 and recently the price started a downside correction. It declined below the $260 level and the 23.6% Fib retracement level of the recent leg from the $232 low to $265 high.
It even traded below $255 and it is currently tested the $248-250 support area. The 50% Fib retracement level of the recent leg from the $232 low to $265 high is also acting as a support. To the downside, there is a strong support forming near the $240 level. Besides, there is also a key bullish trend line forming with support near $240 on the hourly chart of ETH/USD. The trend line coincides with the 76.4% Fib retracement level of the recent leg from the $232 low to $265 high. Therefore, as long as the price is above the $240 support, it is likely to bounce back.
More importantly, the 100 hourly simple moving average is near the trend line and the $240 support. If there is a downside break below the $240 support, the price could retest the $232 support area. On the upside, an initial resistance is near $257-258. If there is an upside break above $260, there are high chances of a fresh high above the $265 level in the near term.
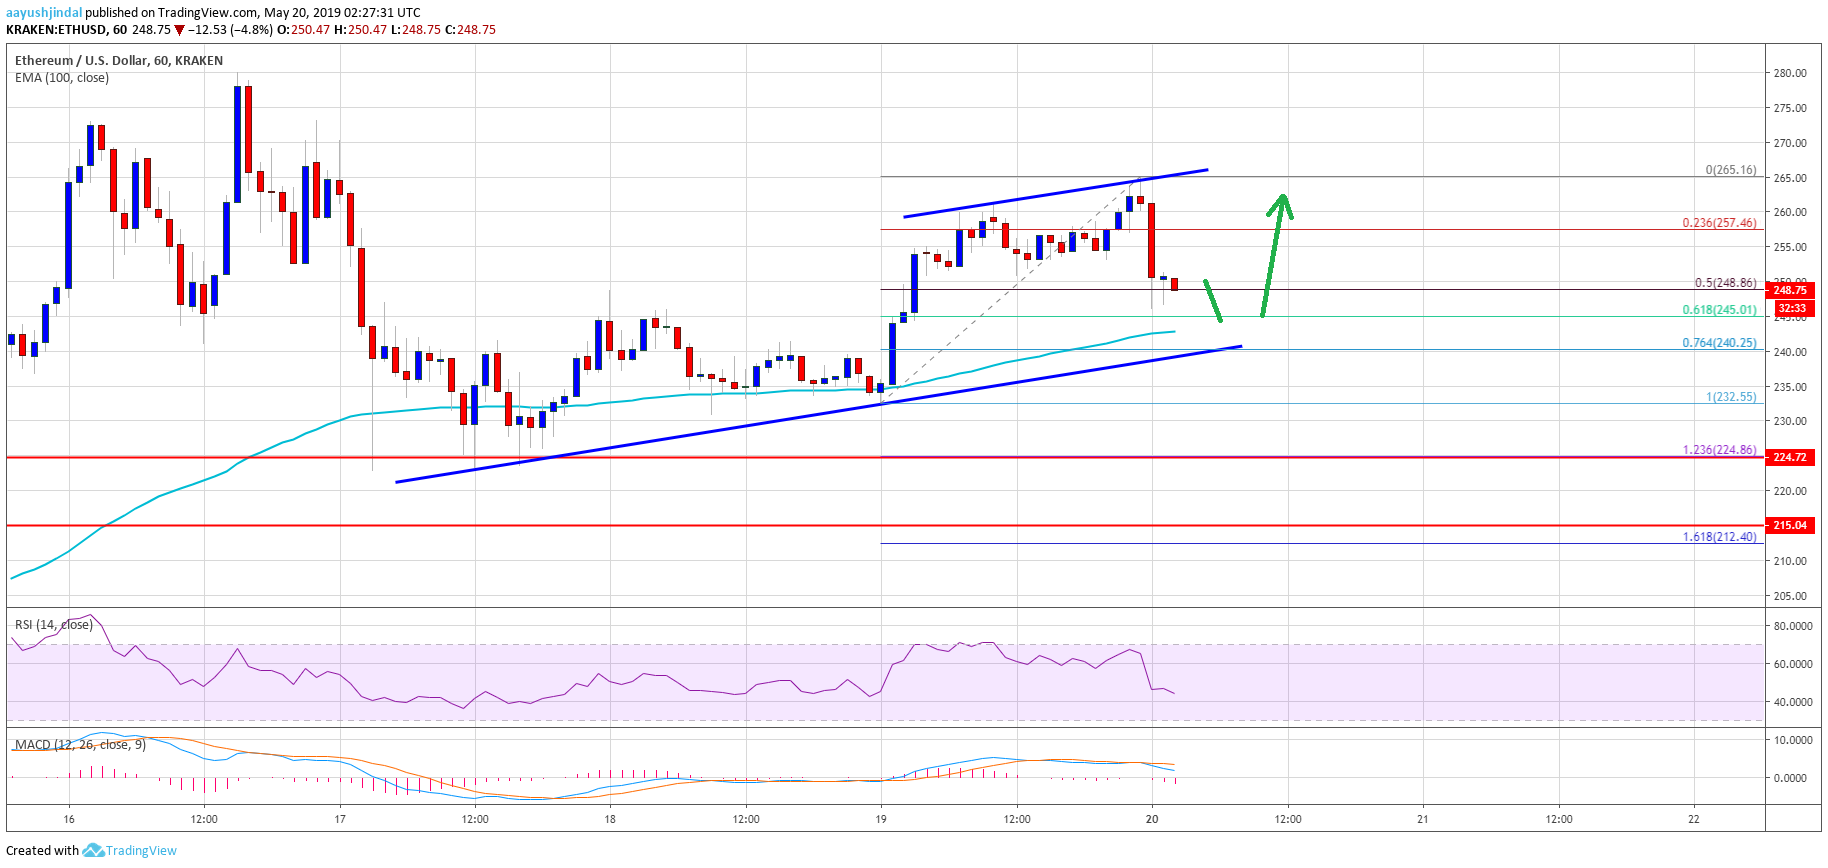
Looking at the chart, Ethereum price is currently correcting lower towards a few important supports near $240. The bulls are likely to remain active as long as the price is above $240 and the 100 hourly SMA. On the upside, a clear break above $257 and $260 might push the price towards $280.
ETH Technical Indicators
Hourly MACD – The MACD for ETH/USD is slowly moving in the bearish zone.
Hourly RSI – The RSI for ETH/USD moved down below 40 and it is currently heading towards the 40 level.
Major Support Level – $240
Major Resistance Level – $260