• Advertise
  • Submit a Press Release
NewsBTC
Bitcoin & cryptocurrency news
Crypto.com Logo
  • Home
  • News
    • Bitcoin
    • Ethereum
    • Cardano
    • Dogecoin
    • Ripple
    • DeFi
    • NFT
    • Sponsored
    • Press Releases
  • Analysis
    • Bitcoin (BTC)
    • Ethereum (ETH)
    • Cardano (ADA)
    • Chainlink (LINK)
    • Litecoin (LTC)
    • Tezos (XTZ)
    • Zcash (ZEC)
    • EOS
    • YearnFinance (YFI)
  • Trading Course
  • Directory
    • Crypto Businesses
    • Bitcoin Brokers
    • Casinos
    • Sportsbooks
  • Play GamesTry
  • Bet & WinTry
No Result
View All Result
NewsBTC
No Result
View All Result
Nexo Logo

Ethereum Price Vulnerable to an Intense Correction: On-Chain Metrics

Ali Martinez by Ali Martinez
2 years ago
in Ethereum, Technical analysis
Reading Time: 2 mins read
Advertisement

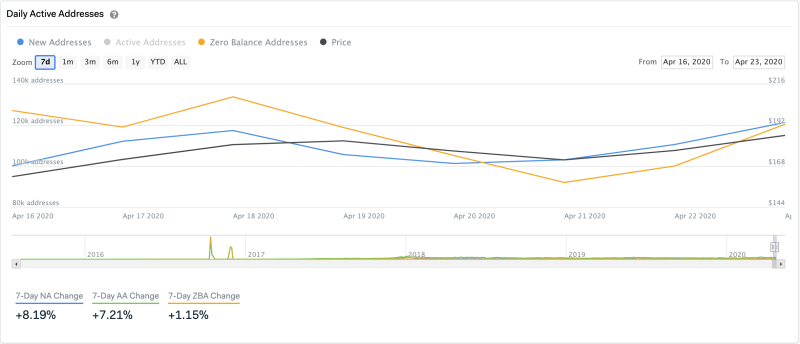
Ethereum is back in the spotlight after surging as high as $195 in the last 24 hours. The bullish impulse saw more than 220,000 addresses that had a balance in Ether go to zero, based on IntoTheBlock’s “Daily Active Addresses” model.

The selling pressure has been so significant that the drop in addresses nearly outpaced the number of new addresses being created in the network, which could spell trouble for the smart contracts giant.

Ethereum Daily Active Addresses by IntoTheBlock
Ethereum Daily Active Addresses. (Source: IntoTheBlock)

Ether’s Network Growth Is Declining

Network growth is one of the most accurate price “foreshadowers,” according to Brian Quinlivan, Market and Social Media Director at Santiment. Quinlivan believes that a rising network growth usually leads to an increase in price. Meanwhile, a lack of newly created addresses indicates a future price slump.

5 BTC + 300 Free Spins for new players & 15 BTC + 35.000 Free Spins every month, only at mBitcasino. Play Now!

The fact that Ether’s network is currently shrinking suggests that a correction is underway. An increase in the selling pressure behind this cryptocurrency would add credence to the bearish outlook.

Breaking below the support provided by the 100-day moving average would likely see Ethereum drop to its 200-day moving average. This support barrier is currently hovering around $172.

Ethereum Daily Chart with 50 and 200-day MA. (Source: TradingView)

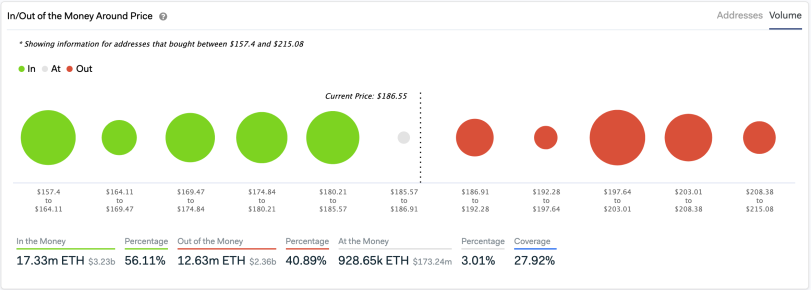
IntoTheBlock’s “In/Out of the Money Around Price” (IOMAP) model indicates that despite the decline in network growth, closing below the 100-day moving average will not be easy. This fundamental index estimates that over 1.5 million addresses bought nearly 5 million ETH at an average price of $185.

BitStarz Player Lands $2,459,124 Record Win! Could you be next big winner?
Get 110 USDT Futures Bonus for FREE!

The massive supply wall might be able to prevent Ether from further correction and serve as a buy zone for sidelined investors.

In/Out of the Money Around Price. (Source: IntoTheBlock)

Everything’s Not Lost

Considering that the 100-day moving average is able to hold, the IOMAP indicates that Ether can freely move towards $200. At the moment, there is not any significant supply barrier between $185 and $200 making such a bullish impulse extremely possible.

A lower time frame such as the 1-hour chart, however, suggests that the area between the lower and upper Bollinger bands is a reasonable no-trade zone. Breaking out of this trading range will determine where Ethereum is headed next.

Ethereum Daily Chart Bollinger Bands. (Source: TradingView)

Moving below the lower Bollinger band at $186 will signal a break of the 100-day moving average, which could be followed by a steeper correction as mentioned before. Conversely, jumping above the $190 resistance level could push Ether towards $200.

It is worth mentioning that the IOMAP reveals that approximately 1.2 million addresses bought nearly 7.8 million ETH around $200. Therefore, this price hurdle could eventually put a stop to Ether’s uprising.

Featured Image from Unsplash
Tweet123Share196ShareSend
Win up to $1,000,000 in One Spin at CryptoSlots
Ali Martinez

Ali Martinez

Ali began forex trading in 2012. In 2014, he came across Bitcoin’s whitepaper and was so fascinated by the idea of a decentralized, borderless, and censorship-resistant currency that he started buying Bitcoin. By 2015, he started traveling to spread the word about Bitcoin. Now, he is a content producer for some of the leading media outlets in the cryptocurrency industry.

Related Posts

Ethereum

TA: Ethereum Close Below $1K Could Spark Larger Degree Downtrend

4 hours ago
Bitcoin

TA: Bitcoin Remains In Downtrend, What Could Spark Sharp Upside

6 hours ago
Cardano

Cardano (ADA) Looks To Recover After Sliding To $0.43 – Pressure’s On For The Bulls

20 hours ago
World Of Women, screenshot from the website

Blue Chip NFTs 101: The World Of Women Collection, Including And Conquering

2 days ago
Ethereum

TA: Ethereum Trims Gains, Why ETH Remains At Risk Below $1,100

3 days ago
Bitcoin

TA: Bitcoin Recovers Sharply, Why BTC Could Still Struggle Above $20,500

3 days ago

Premium Partners

Top Brokers

PrimeXBT

PrimeXBT

Review · Visit

Top Casinos

BitStarz

BitStarz

Review · Visit
7BitCasino

7BitCasino

Review · Visit
BC.Game

BC.Game

Review · Visit
Punt Casino

Punt Casino

Review · Visit
mBit

mBit

Review · Visit
CryptoGames

CryptoGames

Review · Visit
Bspin

Bspin

Review · Visit

Sportsbooks

1xBit

1xBit

Review · Visit
BC.Game

BC.Game

Review · Visit

Web3 Delight Lagos – Breaking barriers to pave the way for the digital future

July 4, 2022

LBank Exchange Will List DOTORI (DTR) on July 4, 2022

July 4, 2022

WorldPF (WDPF) Is Now Available for Trading on LBank Exchange

July 4, 2022

MetaBitcoin (MBTC) attracts investment from Dubai’s first royal crypto fund, Alawad Fund

July 4, 2022

MicroNFT (MNT) Is Now Available for Trading on LBank Exchange

July 4, 2022

ABOUT US

NewsBTC is a cryptocurrency news service that covers bitcoin news today, technical analysis & forecasts for bitcoin price and other altcoins. Here at NewsBTC, we are dedicated to enlightening everyone about bitcoin and other cryptocurrencies.

We cover BTC news related to bitcoin exchanges, bitcoin mining and price forecasts for various cryptocurrencies.

COMPANY

  • Advertising
  • Comments Policy
  • Privacy Center
  • Sitemap
  • About Us
  • Contact

Technical Analysis

  • Bitcoin (BTC)
  • Ethereum (ETH)
  • Ripple (XRP)
  • Chainlink (LINK)
  • Cardano (ADA)
  • Tezos (XTZ)

LINKS

Crypto Prices from Nomics

Cryptocurrency news

  • Bitcoin
  • Ethereum
  • Ripple
  • Chainlink
  • Cardano
  • EOS
  • Tezos

© 2021 NewsBTC. All Rights Reserved.

  • Home
  • News
    • Bitcoin
    • Ethereum
    • Cardano
    • Dogecoin
    • Ripple
    • DeFi
    • NFT
    • Sponsored
    • Press Releases
  • Analysis
    • Bitcoin (BTC)
    • Ethereum (ETH)
    • Cardano (ADA)
    • Chainlink (LINK)
    • Litecoin (LTC)
    • Tezos (XTZ)
    • Zcash (ZEC)
    • EOS
    • YearnFinance (YFI)
  • Trading Course
  • Directory
    • Crypto Businesses
    • Bitcoin Brokers
    • Casinos
    • Sportsbooks
  • Play Games
  • Bet & Win

© 2021 NewsBTC. All Rights Reserved.

This website uses cookies. By continuing to use this website you are giving consent to cookies being used. Visit our Privacy Center or Cookie Policy.