

- ETH price is still trading below the $108 and $110 resistance levels against the US Dollar.
- There is a new connecting bearish trend line formed with resistance near $107 on the hourly chart of ETH/USD (data feed via Kraken).
- The pair remains supported on the downside above the $105 and $103 levels in the near term.
Ethereum price is confined in a tiny range against the US Dollar and bitcoin. ETH/USD could continue to consolidate until trading volumes pick up and price action improves.
Ethereum Price Analysis
There was a downside move from the $110 swing high in ETH price against the US Dollar. The ETH/USD pair traded below the $108 and $106 support levels, plus settled below the 100 hourly simple moving average. It tested the $105 support level, where buyers emerged and protected further losses. Later, there was an upside correction above the $106 and $107 levels. The price even broke the 50% Fib retracement level of the recent decline from the $110 high to $105 swing low. However, the upside move was capped by the $108 resistance area.
Moreover, the price was rejected near the 61.8% Fib retracement level of the recent decline from the $110 high to $105 swing low. There is also a new connecting bearish trend line formed with resistance near $107 on the hourly chart of ETH/USD. The pair is currently trading well below the $108 resistance and the 100 hourly simple moving average. A successful break above the trend line, 100 hourly simple moving average, and the $108 resistance is needed for more gains. The next major resistance is near the $110 level, above which the price could rally towards $115.
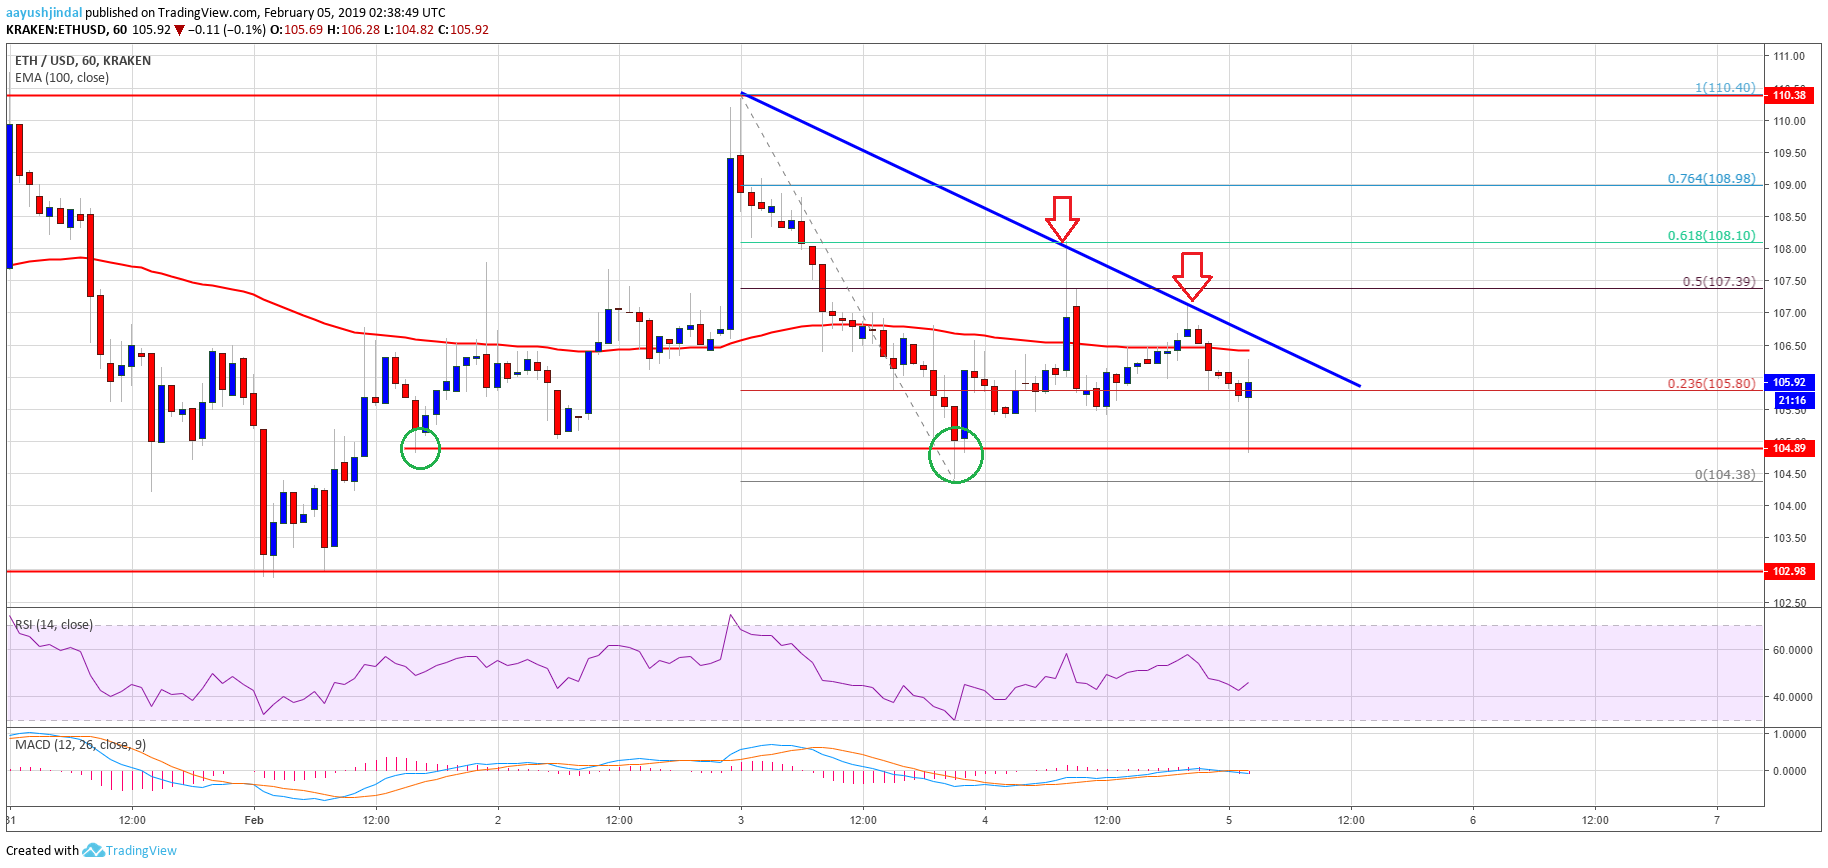

Looking at the chart, ETH price is clearly trading in a range below the $108 and $110 resistance levels. On the downside, an initial support is at $105, below which the price may test the $103 support level.
ETH Technical Indicators
Hourly MACD – The MACD for ETH/USD is slowly moving back in the bearish zone.
Hourly RSI – The RSI for ETH/USD is now well below the 50 level, with a few bearish signs.
Major Support Level – $103
Major Resistance Level – $108