

- ETH price struggled to settle above the $108 resistance area and declined recently against the US Dollar.
- There was a break below a key bullish trend line with support at $106 on the hourly chart of ETH/USD (data feed via Kraken).
- The pair is now trading well below the $108 resistance and the 100 hourly simple moving average.
Ethereum price failed to gain momentum and moved back in a bearish zone against the US Dollar and bitcoin. ETH/USD could revisit the $102 support area in the near term.
Ethereum Price Analysis
This past week, ETH price found support near the $102 level and later recovered against the US Dollar. The ETH/USD pair traded above the $106 and $108 resistance levels. There was also a close above the $108 level and the 100 hourly simple moving average. However, the price failed to break the $110 resistance level and later started a fresh decline. It moved below the 50% Fib retracement level of the last wave from the $102 low to $110 high. Besides, there was a break below $106 and the 100 hourly simple moving average.
The decline was strong as the price tested the $105 support level. More importantly, there was a break below a key bullish trend line with support at $106 on the hourly chart of ETH/USD. The pair tested the 76.4% Fib retracement level of the last wave from the $102 low to $110 high. At the moment, the price is correcting higher, but the previous support near $106 is acting as a resistance. Moreover, the 100 hourly SMA is acting as a strong barrier near the $106-107 zone. Therefore, a proper break above the $106, $107 and $108 levels is must for a decent upward move.
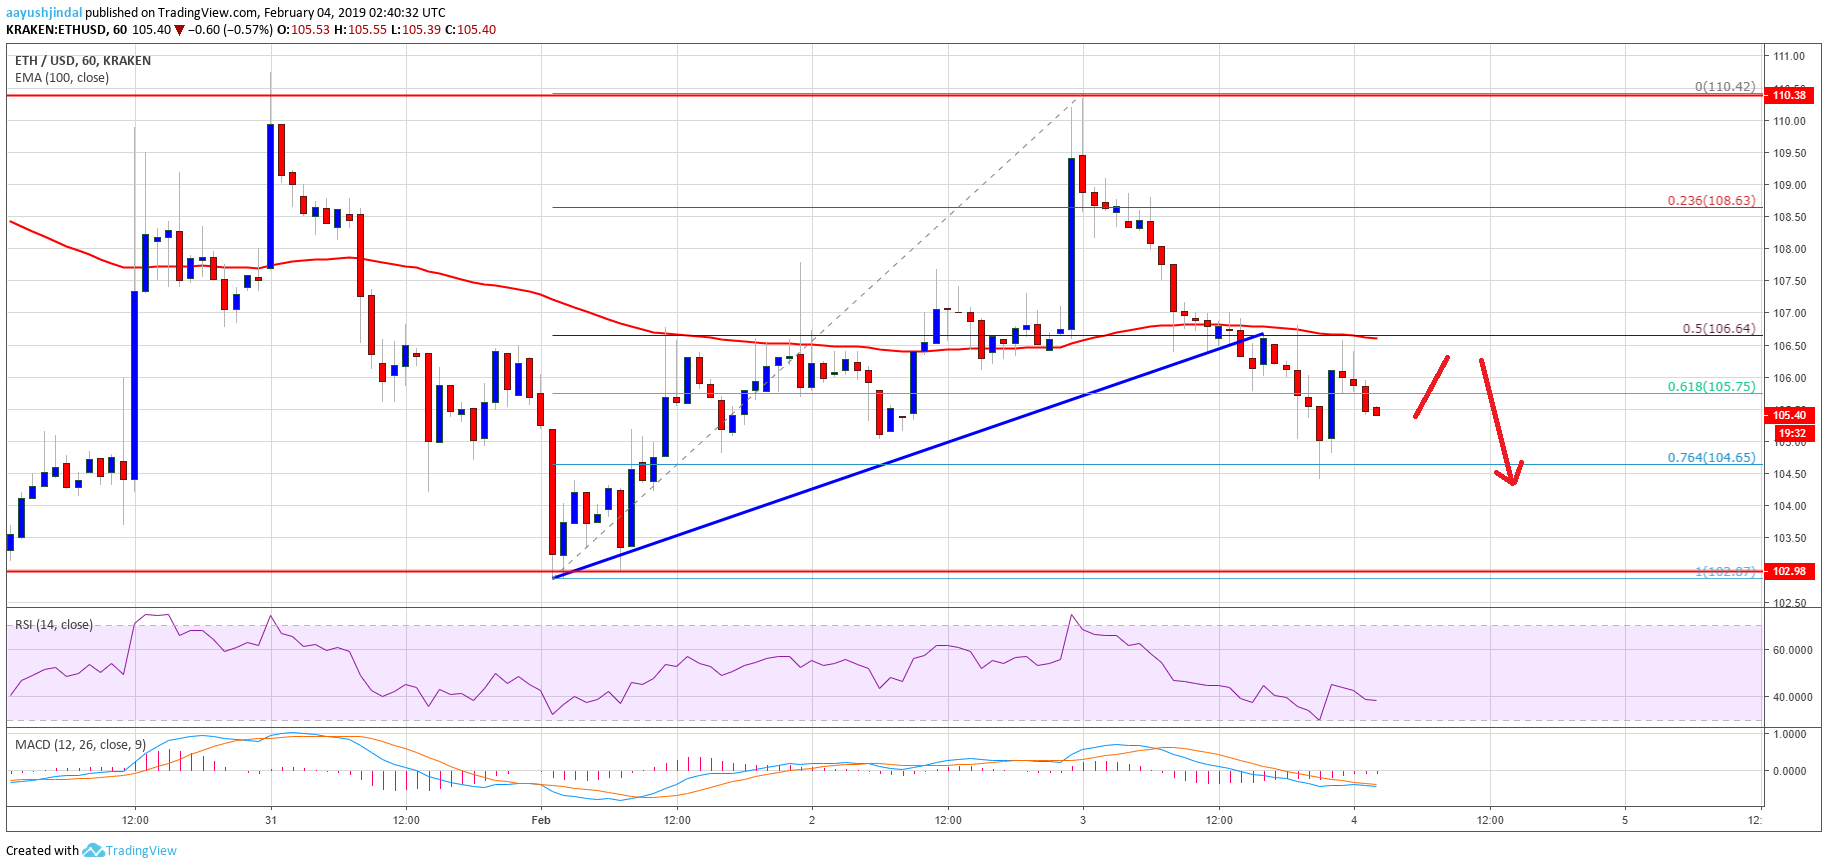

Looking at the chart, ETH price seems to be trading in a broad range above the $102 support. If there is a downside break below $102 and $101, the price could test the $95 level.
ETH Technical Indicators
Hourly MACD – The MACD for ETH/USD is back in the bearish zone.
Hourly RSI – The RSI for ETH/USD moved below the 40 level, with a bearish angle.
Major Support Level – $102
Major Resistance Level – $107