Reason to trust
How Our News is Made
Strict editorial policy that focuses on accuracy, relevance, and impartiality
Ad discliamer
Morbi pretium leo et nisl aliquam mollis. Quisque arcu lorem, ultricies quis pellentesque nec, ullamcorper eu odio.
- ETH price declined recently, tested the $100 support, and later recovered against the US Dollar.
- There is a major bearish trend line formed with resistance near $105 on the hourly chart of ETH/USD (data feed via Kraken).
- The pair is likely to face a strong resistance near $105 and the 100 hourly simple moving average.
Ethereum price started a short term correction against the US Dollar and bitcoin. ETH/USD is likely to fail near $105 or $107 and it will most likely resume its slide.
Ethereum Price Analysis
Yesterday, there was a major downside move below the $105 support in ETH price against the US Dollar. The ETH/USD pair declined sharply below the $105 level and traded towards the $100 level. The price even settled below the $105 level and the 100 hourly simple moving average. After testing the $100 support, the price started a short term upside correction. It traded above the 50% Fib retracement level of the recent decline from the $107 high to $100 low. However, the price faced a strong resistance near $105 and the 100 hourly simple moving average.
Additionally, the price failed to gain strength above the 61.8% Fib retracement level of the recent decline from the $107 high to $100 low. More importantly, there is a major bearish trend line formed with resistance near $105 on the hourly chart of ETH/USD. The pair is currently consolidating below the trend line, $105 and the 100 hourly SMA. To recover further, the price must break $105 and the 100 hourly SMA. The next crucial resistance is near the $107 level, which acted as a hurdle on many occasions in the past. On the other hand, if the price fails to move above $105, it could resume its decline.
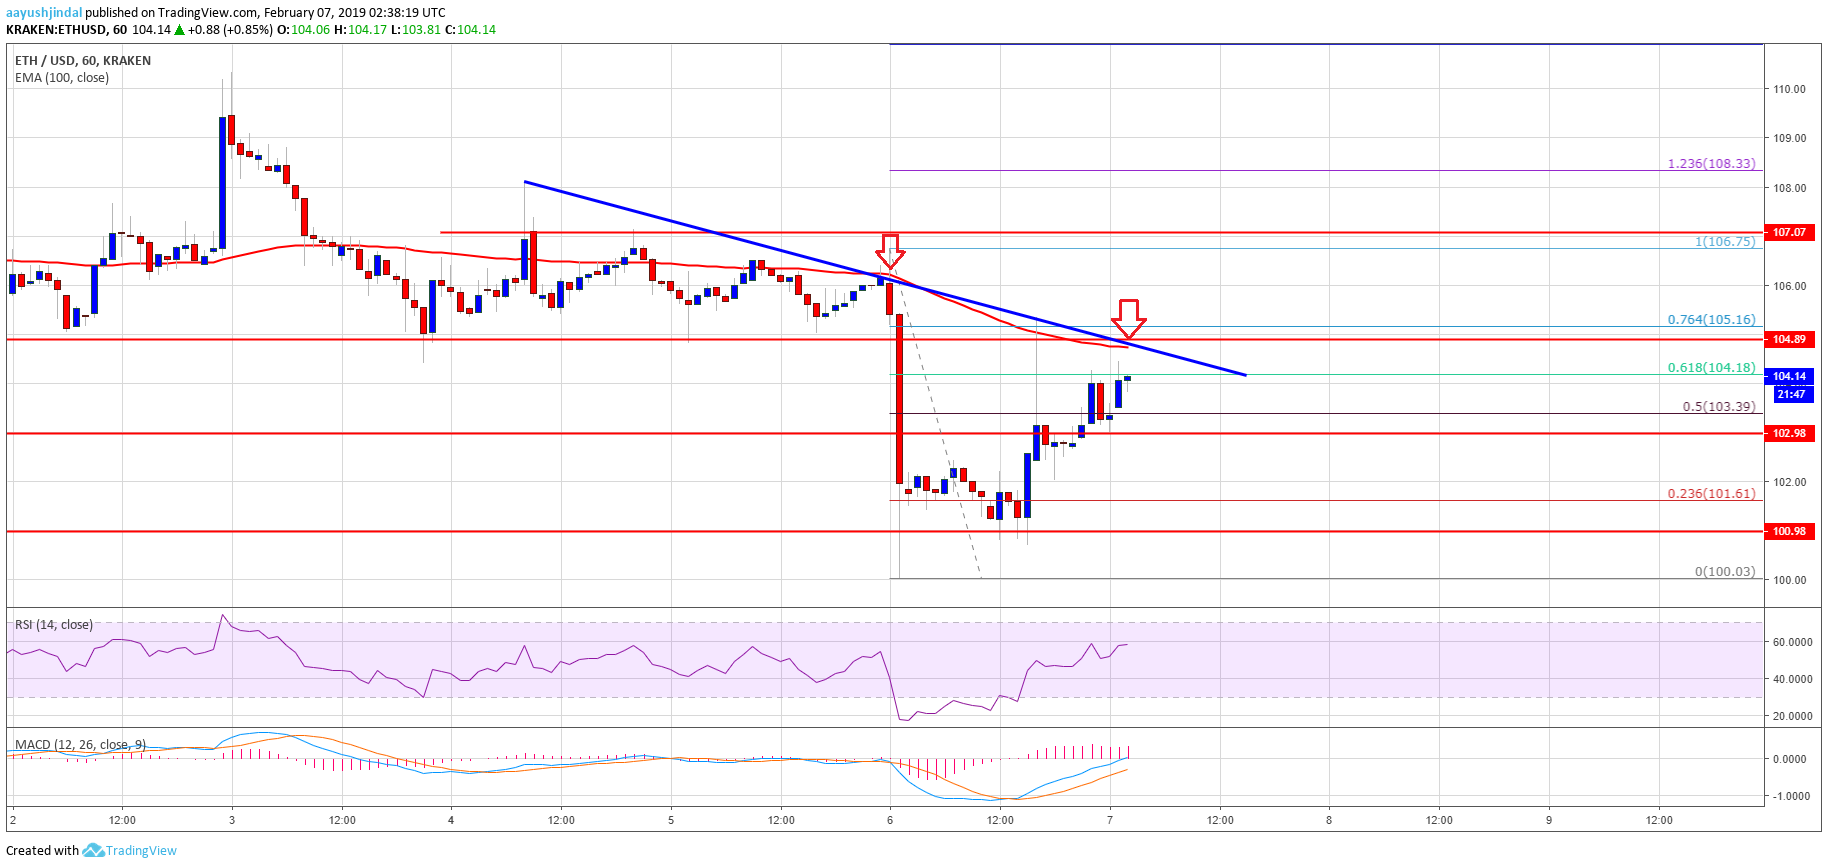
Looking at the chart, ETH price is clearly facing an uphill task near $105 and $107. Therefore, there is a risk of a fresh drop towards the $102 and $100 levels.
ETH Technical Indicators
Hourly MACD – The MACD for ETH/USD moved back in the bullish zone.
Hourly RSI – The RSI for ETH/USD jumped above the 50 level, with a positive angle.
Major Support Level – $102
Major Resistance Level – $105