

Key Highlights
- ETH price recovered a few points, but it failed to clear the $130 and $131 resistances against the US Dollar.
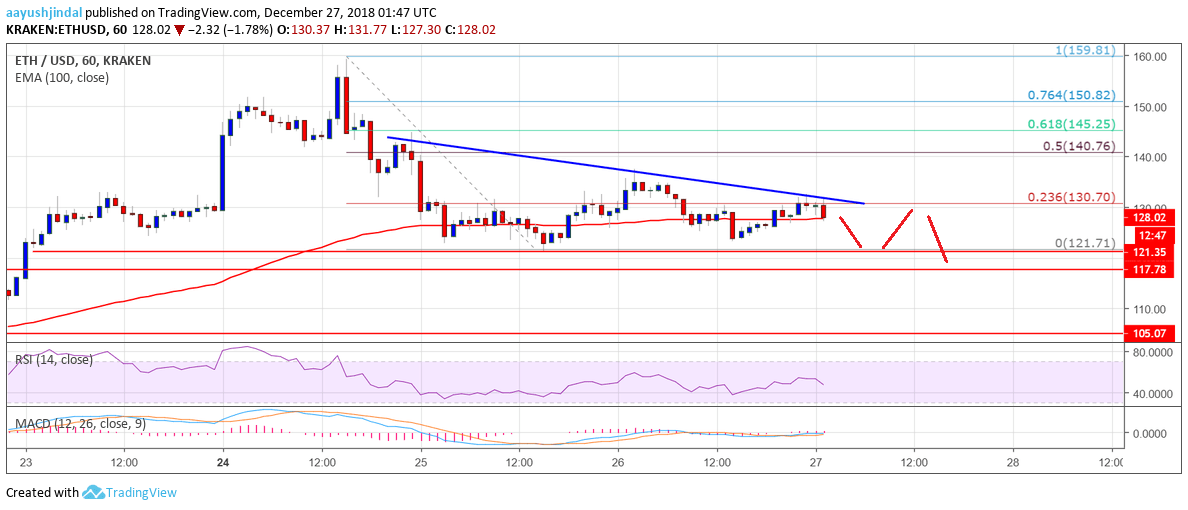
- There is a major bearish trend line in place with resistance at $130 on the hourly chart of ETH/USD (data feed via Kraken).
- The pair is likely to struggle near $130 and it may decline further in the short term.
Ethereum price is facing an uphill task against the US Dollar and bitcoin. ETH/USD may continue to face a strong resistance near the $130 zone.
Ethereum Price Analysis
Recently, we saw a minor upside correction above $130 in ETH price against the US Dollar. The ETH/USD pair even moved above the $134 level, but gains were limited. There was even a push above the 23.6% Fib retracement level of the recent drop from the $160 swing high to $121 low. However, the price struggled to settle above the $135 resistance and later declined.
There was a break below the $126 level and the 100 hourly simple moving average. However, the price remained above the $121 support and it is currently consolidating losses. More importantly, there is a major bearish trend line in place with resistance at $130 on the hourly chart of ETH/USD. A break above trend line and then $131 may push the price towards the $135 resistance. The main resistance is near $140 and the 50% Fib retracement level of the recent drop from the $160 swing high to $121 low. On the downside, the $121 support area holds a lot of importance. If there is a break below $121, the price could extend declines.

Looking at the chart, ETH price seems to be struggling to regain bullish momentum above $130 and $135. Therefore, there is a risk of a downside break below $121.
Hourly MACD – The MACD is slightly placed in the bullish zone.
Hourly RSI – The RSI is slowly moving lower towards the 50 level.
Major Support Level – $121
Major Resistance Level – $135