

- ETH price is slowly moving higher and it remains well supported near $119 against the US Dollar.
- There is a major bullish trend line formed with support at $119 on the hourly chart of ETH/USD (data feed via Kraken).
- The pair could dip a few points, but it is likely to find buyers near $119, $118 or $117 in the short term.
Ethereum price is placed nicely in a bullish trend against the US Dollar and bitcoin. ETH/USD may continue to move higher towards $125 and $128 in the coming sessions.
Ethereum Price Analysis
Recently, we saw a short term downside correction from the $125 high in ETH price against the US Dollar. The ETH/USD pair traded below the $122 and $120 support levels. However, the $117-118 area acted as a strong support and prevented further losses. Downsides were contained and later the price moved back above the $119 resistance level. Besides, there was a break above the 50% Fib retracement level of the recent drop from the $125 high to $117 swing low.
The price even spiked above the $121 level and it is currently well above the 100 hourly simple moving average. However, the recent upward move faced sellers near the $122-123 zone. Additionally, the 61.8% Fib retracement level of the recent drop from the $125 high to $117 swing low acted as a resistance. The price is currently placed well above $120 and it seems like it may continue to move higher. On the upside, the main resistances are near the $123 and $125 levels. On the downside, there is a major bullish trend line formed with support at $119 on the hourly chart of ETH/USD.
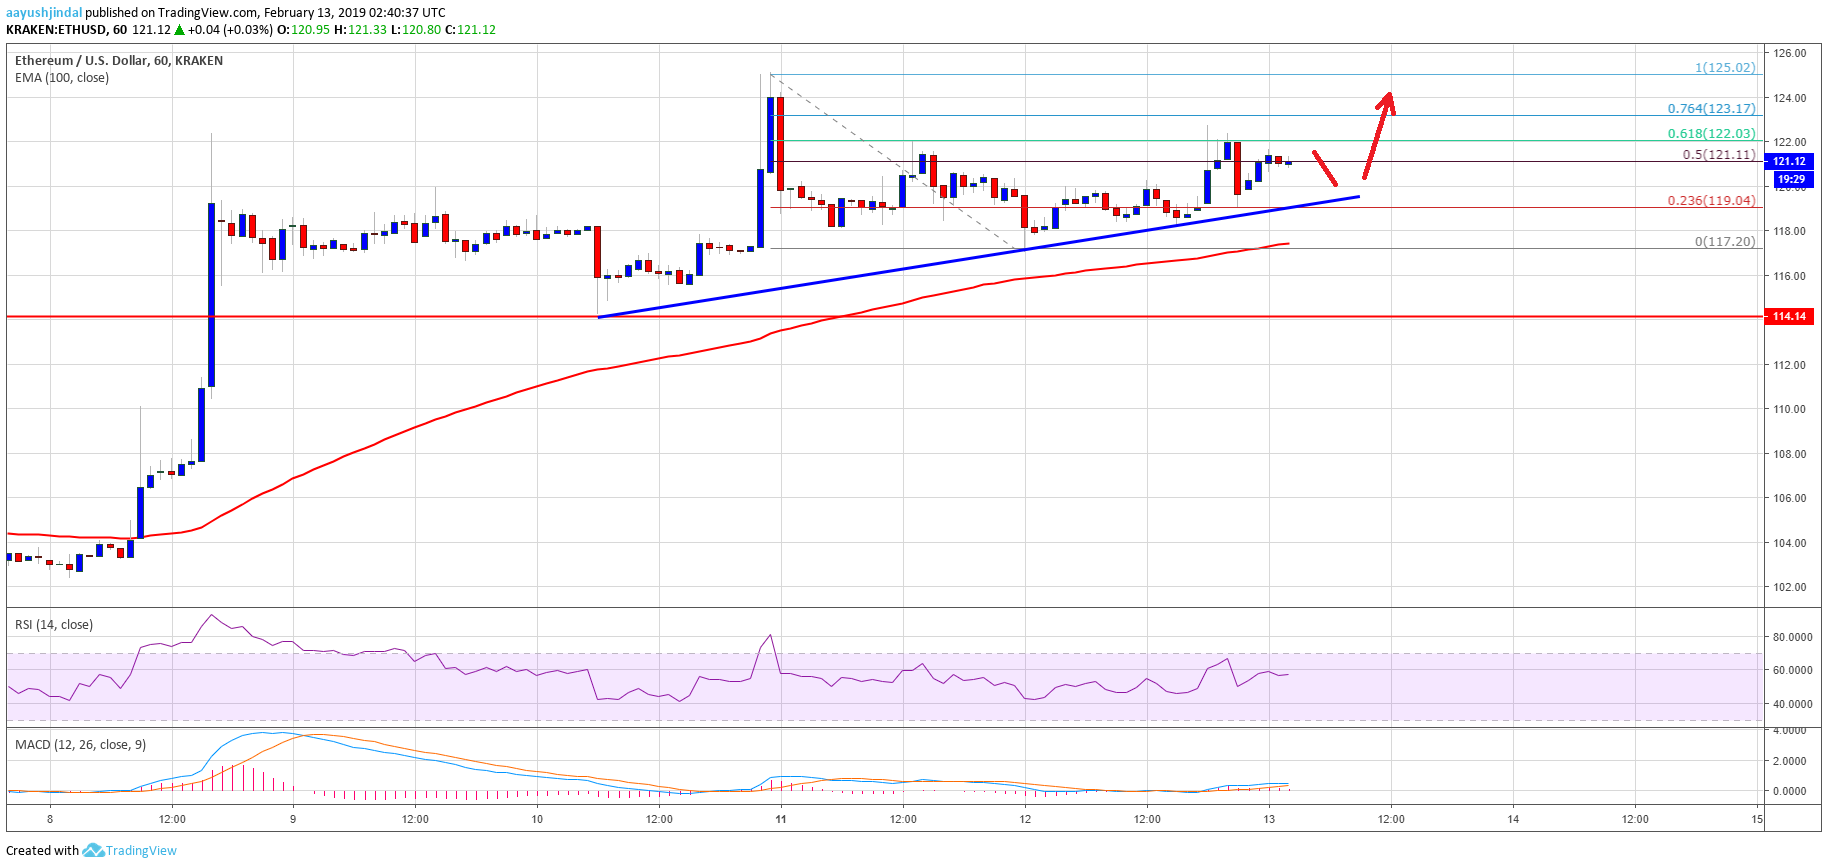

Looking at the chart, ETH price is clearly trading with a positive bias above $117 and $119. If there are corrective moves, buyers are likely to protect declines below $117. On the upside, a break above $125 might push the price towards the $128 level.
ETH Technical Indicators
Hourly MACD – The MACD for ETH/USD is currently moving in the bullish zone.
Hourly RSI – The RSI for ETH/USD is currently just below the 60 level, with a slight bearish angle.
Major Support Level – $119
Major Resistance Level – $123