

Key Highlights
- ETH price traded in a range above the $146 support area against the US Dollar.
- There are two major bearish trend lines formed with resistance at $152 and $154 on the hourly chart of ETH/USD (data feed via Kraken).
- The pair could decline below the $146 support if buyers struggle to push the price above $154.
Ethereum price is trading in a tight range against the US Dollar and bitcoin. ETH/USD remains at a risk of a downside break as long as it is below $154.
Ethereum Price Analysis
After forming a support base near $146, ETH price recovered a few points against the US Dollar. The ETH/USD pair traded above the $148 and $150 resistance levels. There was also a break above the 23.6% Fib retracement level of the last slide from the $160 high to $146 swing low. However, the upside move was capped by the $153-154 resistance zone. There was also no proper close above $152 and the 100 hourly simple moving average. Besides, the 50% Fib retracement level of the last slide from the $160 high to $146 swing low acted as a resistance.
The price declined again and moved below the $152 level and the 100 hourly SMA. It is currently consolidating near the $150 level, with a minor bearish angle. On the upside, there is a strong resistance formed near $154. There are also two major bearish trend lines formed with resistance at $152 and $154 on the hourly chart of ETH/USD. Above the trend lines, the price could trade towards the $157 resistance area. A clear break above $157 and 76.4% Fib retracement level of the last slide may push the price towards $160.
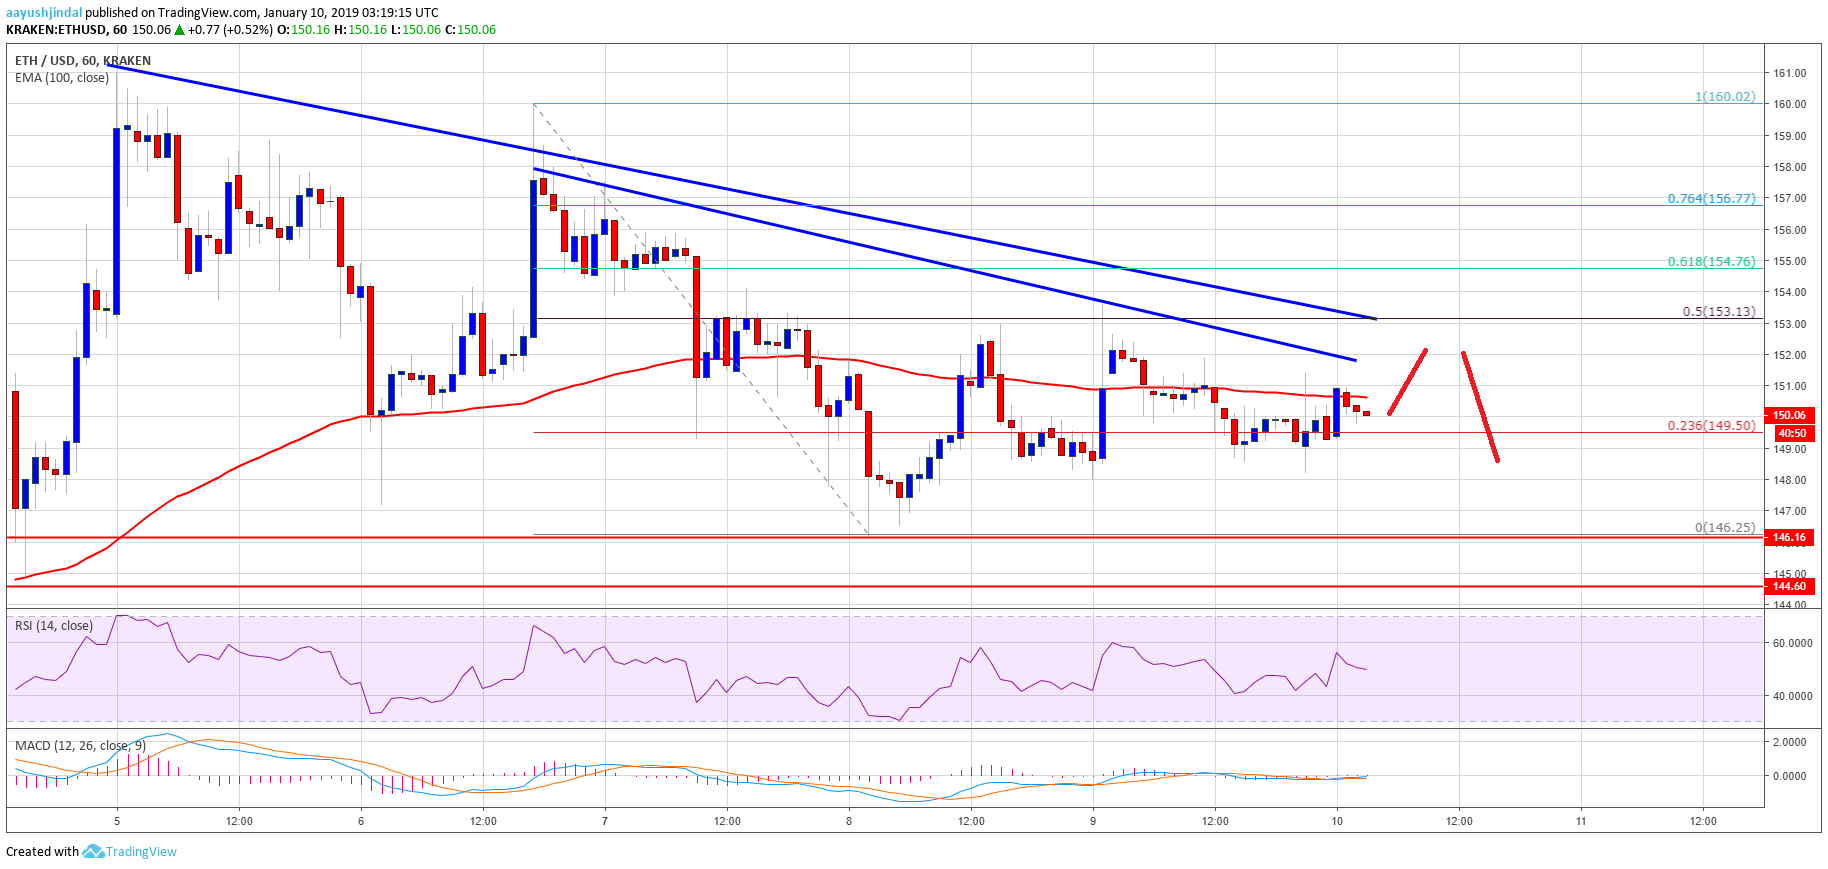

Looking at the chart, ETH price seems to be aligning for the next move either above $154 or below $146. If buyers continue to face hurdles near $154, there is a risk of a downside break below $146.
Hourly MACD – The MACD for ETH/USD is currently flat in the bearish zone, with a minor bearish angle.
Hourly RSI – The RSI for ETH/USD is pointing no major breakout signal below the 60 level.
Major Support Level – $146
Major Resistance Level – $154