

Key Highlights
- ETH price recovered nicely and tested an important resistance near the $198.50 level against the US Dollar.
- Yesterday’s highlighted major bearish trend line is intact with resistance at $197 on the hourly chart of ETH/USD (data feed via Kraken).
- The pair must break the $197 and $198 resistance levels to trade further higher in the near term.
Ethereum price recovered a few points against the US Dollar and bitcoin. However, ETH/USD faced a strong resistance zone near the $198 level.
Ethereum Price Analysis
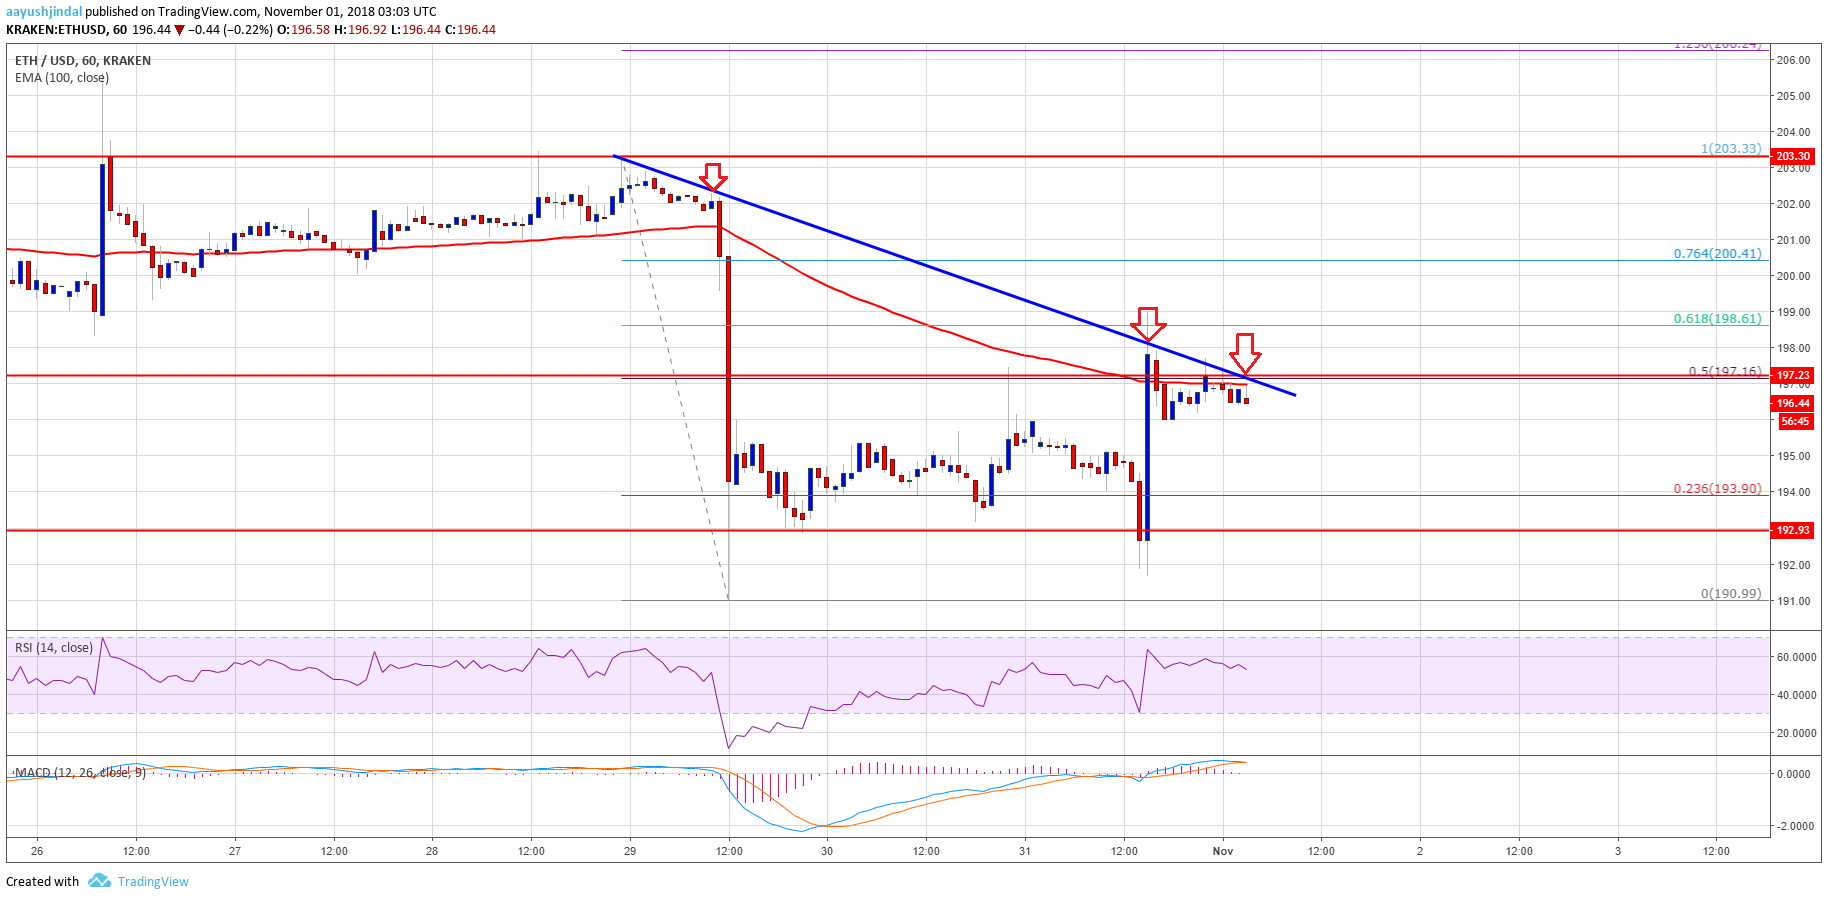
Recently, ETH price dipped sharply from the $197 resistance against the US Dollar. The ETH/USD pair declined and retested the last swing low near the $1952 level. Buyers appeared, protected further losses, and finally pushed the price back above the $195 level. The price bounced back sharply and traded above the $197 level as well. Besides, there was a break above the 50% Fib retracement level of the recent downside from the $203 high to $191 low.
However, the price failed near a crucial resistance at $198. More importantly, yesterday’s highlighted major bearish trend line is intact with current resistance at $197 on the hourly chart of ETH/USD. Furthermore, the 61.8% Fib retracement level of the recent downside from the $203 high to $191 low acted as a strong resistance. The price is currently trading just below the $197 level, trend line, and the 100 hourly simple moving average. A proper break above the trend line, $197, and $198 is needed for further gains in the near term. If not, the price could decline back towards the $195 or $194 level.

Looking at the chart, ETH price recovered nicely from the $192 zone. Having said that, it ran into the key resistance near $197-198. Thus, as long as the price is below $198, it may well decline once again.
Hourly MACD – The MACD is about to move back in the bearish zone.
Hourly RSI – The RSI is currently above the 50 level.
Major Support Level – $192
Major Resistance Level – $198