

Key Highlights
- ETH price failed to stay above the key $109 support and declined recently against the US Dollar.
- Yesterday’s highlighted important bearish trend line is intact with resistance at $114 on the hourly chart of ETH/USD (data feed via Kraken).
- The pair may correct higher in the short term, but upsides remain capped near $112 and $114.
Ethereum price fell further against the US Dollar and bitcoin. ETH/USD could continue to move down and it may even test the $102 support zone.
Ethereum Price Analysis
Yesterday, we discussed a couple of important resistances near $119 and $120 for ETH price against the US Dollar. The ETH/USD pair failed to break the $119 and $120 resistance and declined recently. The price traded below the key $109 support to move further into a bearish zone. It is now trading well below the $119 resistance and the 100 hourly simple moving average.
The recent low was formed near $104 and the price is currently consolidating losses. An initial resistance is near the 23.6% Fib retracement level of the recent decline from the $117 high to $104 low. However, the key hurdle for buyers is near the $113 level and the 100 hourly simple moving average. Besides, yesterday’s highlighted important bearish trend line is intact with resistance at $114 on the hourly chart of ETH/USD. The trend line is above the 61.8% Fib retracement level of the recent decline from the $117 high to $104 low. Therefore, it won’t be easy for buyers to clear the $113 and $114 resistance levels.
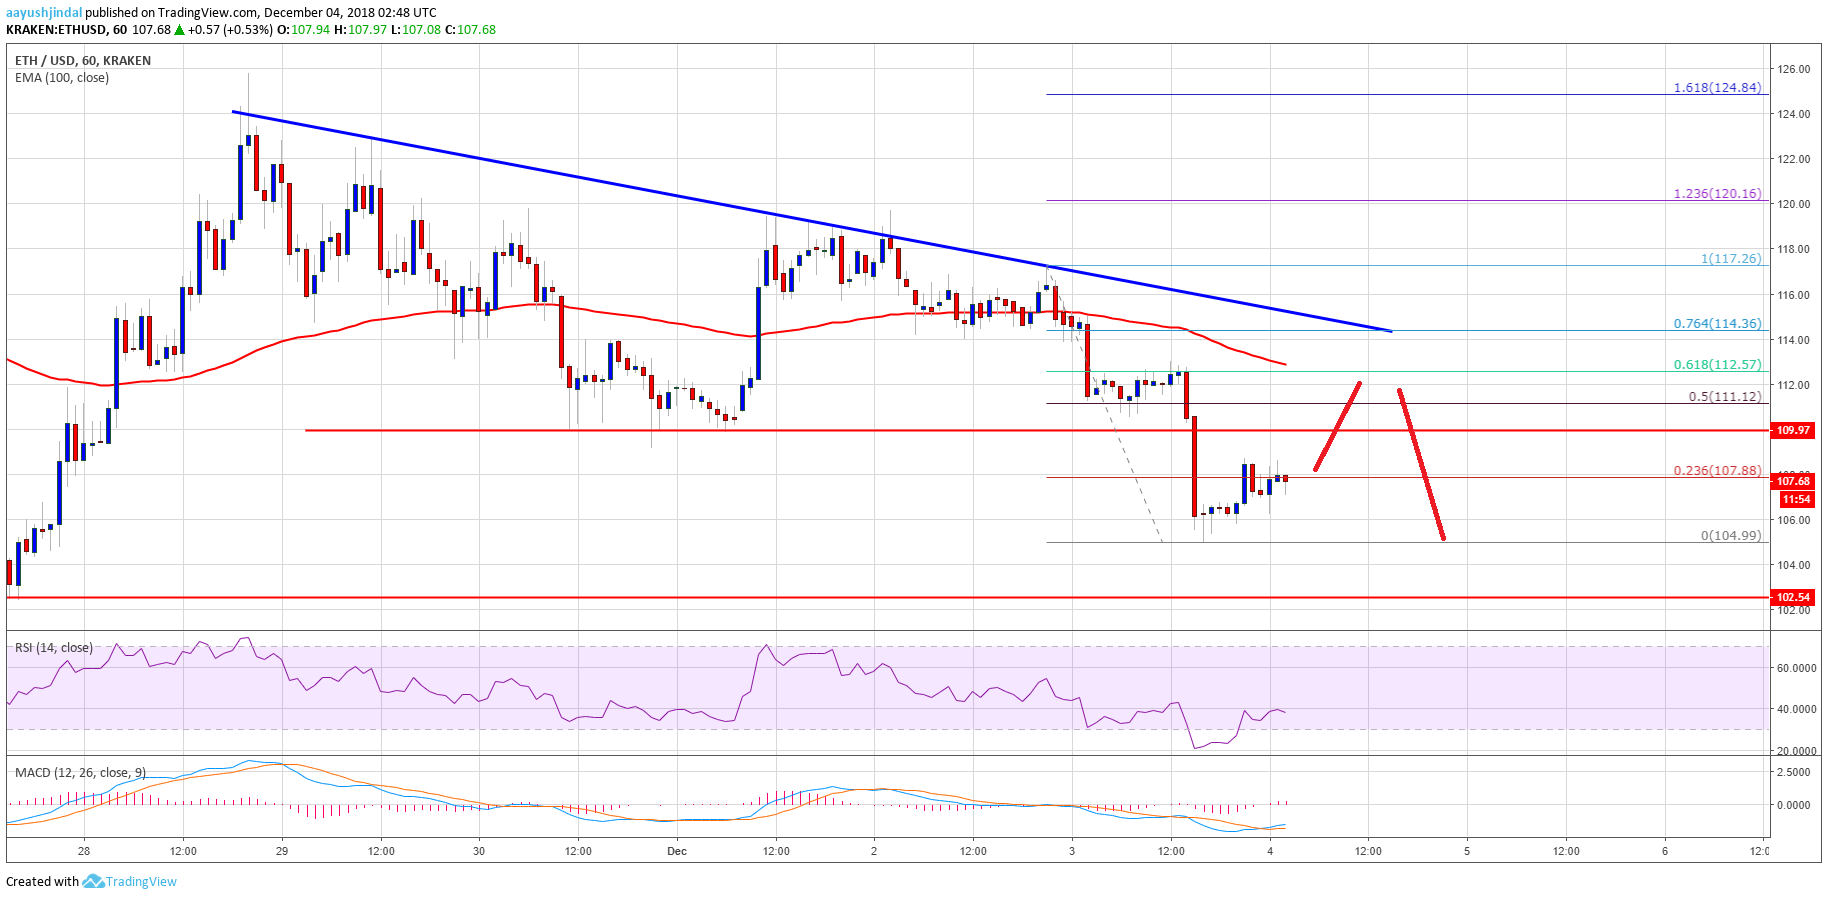

Looking at the chart, ETH price is clearly under a lot of pressure below the $114 resistance level. If there is a break below the $104 swing low, the price may even test the $102 support area. On the upside, a break above $114 may push the price towards $119.
Hourly MACD – The MACD is slowly moving in the bullish zone.
Hourly RSI – The RSI is now well below the 50 level.
Major Support Level – $102
Major Resistance Level – $114