

Key Highlights
- ETH price climbed higher sharply and broke the $150 resistance area against the US Dollar.
- There is a short term bullish flag pattern formed with support at $150 on the hourly chart of ETH/USD (data feed via Kraken).
- The pair is gaining momentum and it may extend gains above the $155 level in the near term.
Ethereum price is trading nicely against the US Dollar and bitcoin. ETH/USD is placed nicely above the $144 support and it may continue to move higher.
Ethereum Price Analysis
Yesterday, we discussed that ETH price could revisit the $150 and $155 levels against the US Dollar. The ETH/USD pair did move higher, broke the $144 resistance and climbed towards the $150 and $155 resistance levels. A new weekly high was formed at $156 and later the price started a downside correction. It declined below the $155 and $152 levels, but it is currently well above the 100 hourly simple moving average.
There was a break below the 23.6% Fib retracement level of the last wave from the $139 low to $156 high. However, there are many supports near the $150 and $144 levels. Moreover, there is a short term bullish flag pattern formed with support at $150 on the hourly chart of ETH/USD. Below the channel support, the next buy zone is near the $148 level. It represents the 50% Fib retracement level of the last wave from the $139 low to $156 high. Therefore, if there is a downside correction, the price may find support near $150 or $148.
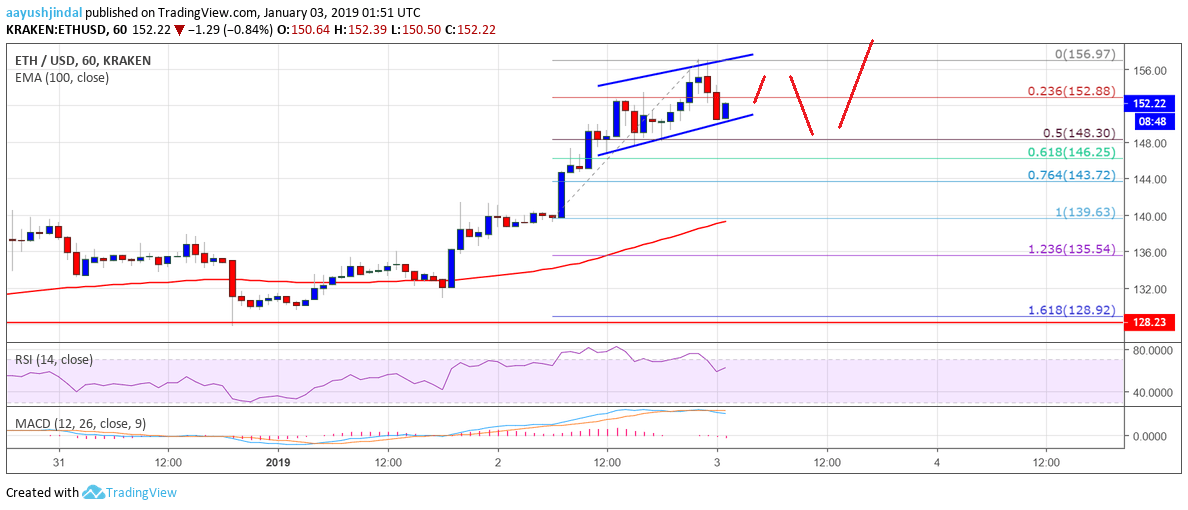

Looking at the chart, ETH price is trading nicely above the $144 support. The price action is positive and it seems like there could be more gains above the $155 level. On the downside, the main supports are $148 and $144.
Hourly MACD – The MACD is slightly placed in the bearish zone.
Hourly RSI – The RSI is now placed well above the 50 level.
Major Support Level – $144
Major Resistance Level – $155