

- ETH price failed to move past the $105 resistance and later declined against the US Dollar.
- Yesterday’s highlighted crucial bearish trend line is intact with resistance near $104 on the hourly chart of ETH/USD (data feed via Kraken).
- The pair must break the $104 and $105 resistance levels to start a decent upside correction.
Ethereum price recovery remained capped against the US Dollar and bitcoin. ETH/USD may continue to consolidate above the $100 support before the next key break.
Ethereum Price Analysis
Yesterday, there was a short term upside correction from the $100 swing low in ETH price against the US Dollar. The ETH/USD pair traded above the $102 and $104 resistance levels. However, the price failed near a major resistance area at $105 and the 100 hourly simple moving average. Moreover, there was a failure observed near the 61.8% Fib retracement level of the last drop from the $107 high to $100 low. The price topped near the $105 level and later started a downside move.
It broke the $104 level and the 23.6% Fib retracement level of the recent wave from the $100 swing low to $105 swing high. On the downside, there are a few supports near the $103 level. If the price continues to move down, it could test the $102 level. It represents the 61.8% Fib retracement level of the recent wave from the $100 swing low to $105 swing high. The main support is at $100, below which there is a risk of a sharp drop towards the $95 support. On the upside, there are many hurdles near the $104 and $105 resistance levels. Additionally, yesterday’s highlighted crucial bearish trend line is intact with resistance near $104 on the hourly chart of ETH/USD.
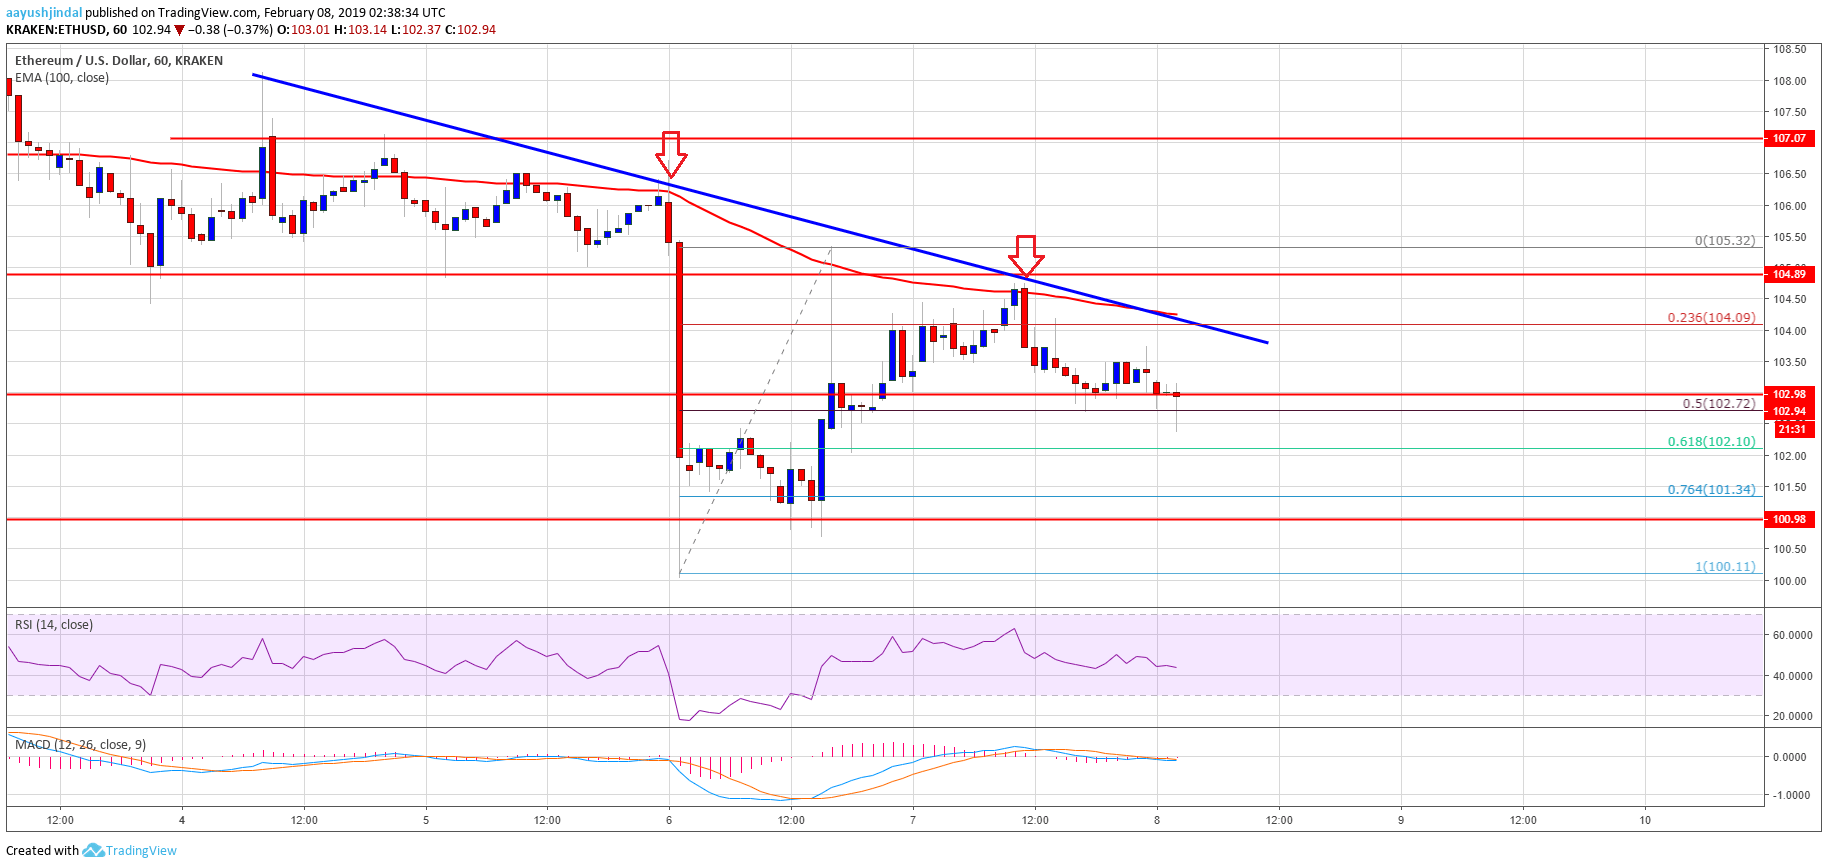

Looking at the chart, ETH price remains below the key $104 and $105 resistance levels. If buyers continue to struggle near the $105 level, there could be a downside reaction below the $100 support.
ETH Technical Indicators
Hourly MACD – The MACD for ETH/USD is slowly moving back in the bearish zone.
Hourly RSI – The RSI for ETH/USD is back below the 50 level, with a bearish angle.
Major Support Level – $100
Major Resistance Level – $105