

- ETH price is still struggling to gain momentum above the $180-$181 resistance area against the US Dollar.
- The price is slowly moving lower and it could decline further towards the $174 support area.
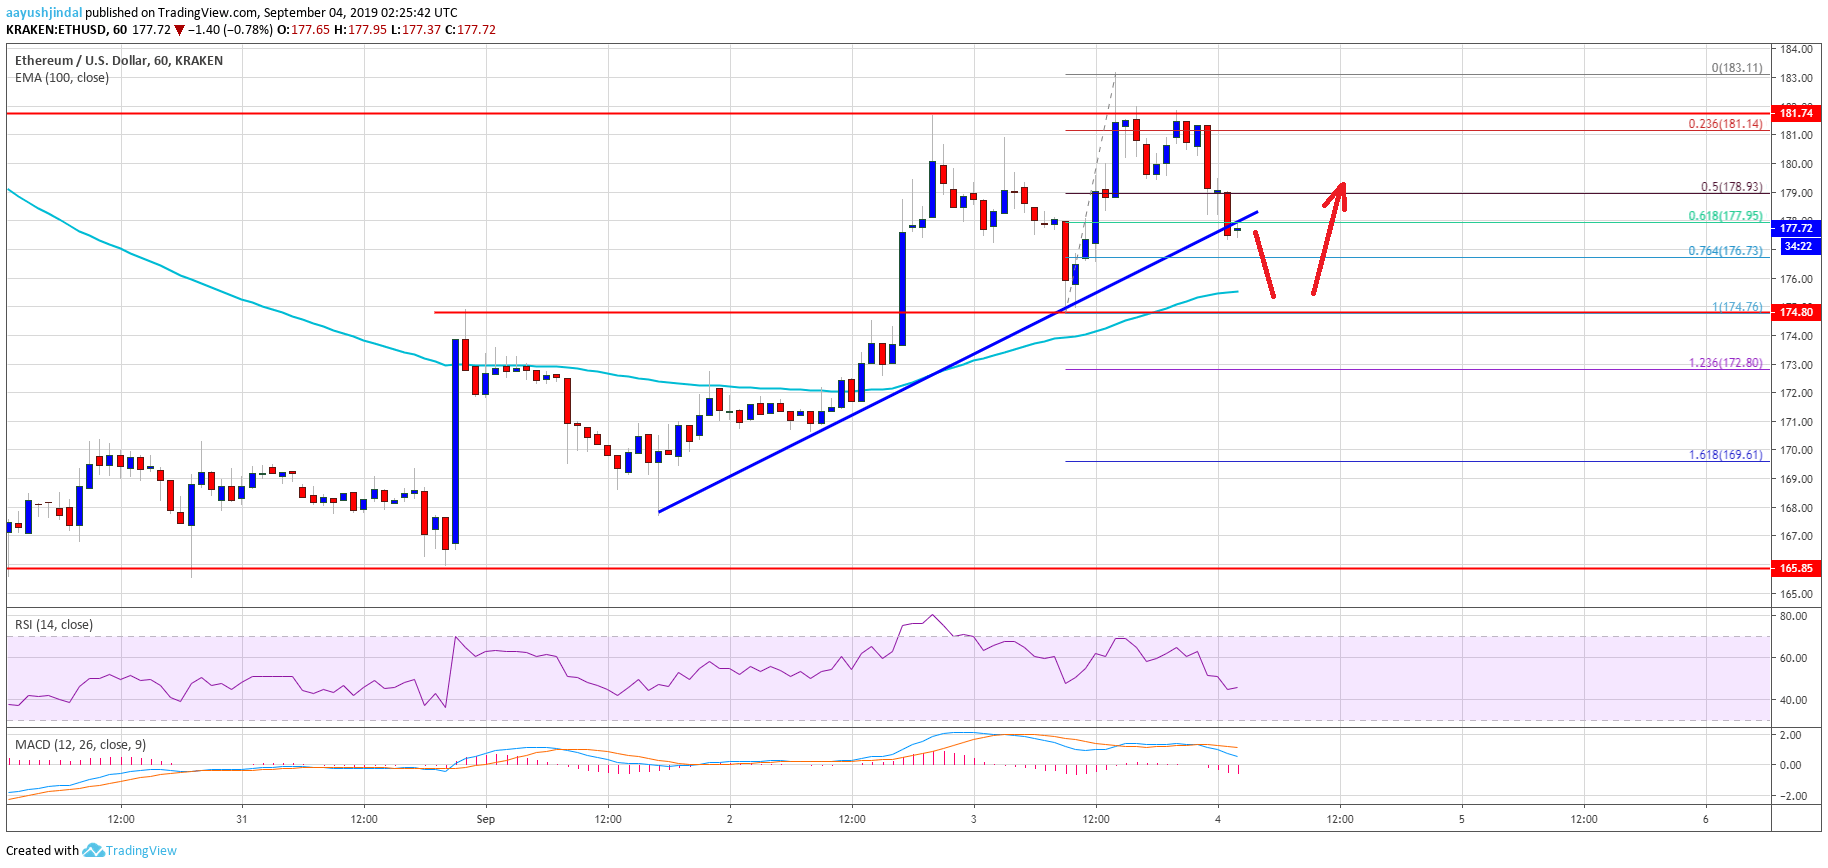
- A major bullish trend line is at risk with support near $178 on the hourly chart of ETH/USD (data feed via Kraken).
- Bitcoin price is climbing higher and it seems like the bulls may gain traction above $10,500.
Ethereum price is struggling to continue higher versus the US Dollar, while bitcoin is surging. ETH price could retest $174 or $172 before it starts a fresh increase.
Ethereum Price Analysis
Yesterday, we saw a decent upward move in bitcoin, Ethereum, ripple and binance coin against the US Dollar. ETH price climbed above the key $172 and $175 resistance levels. Moreover, there was a close above $175 and the 100 hourly simple moving average. However, the price struggled to gain momentum above the $180 and $181 resistance levels. As a result, there was a bearish reaction and the price tested the $175 support area.
Later, it bounced back above $180, but failed to continue higher. A swing high was formed near $183 and the price is currently correcting lower. It traded below the $180 level and the 50% Fib retracement level of the recent wave from the $174 swing low to $183 high. At the moment, a major bullish trend line is at risk with support near $178 on the hourly chart of ETH/USD.
Moreover, the price is struggling to hold the 61.8% Fib retracement level of the recent wave from the $174 swing low to $183 high. Therefore, Ethereum might continue to move down towards the $175 and $174 support levels. Additionally, the 100 hourly simple moving average is also waiting near the $175 level to act as a support. If there is a break below $174, the price could even test the $172 support area.
On the upside, the key resistance is near the $180 and $182 levels. To continue higher, the price must settle above the $182 level and gain strength above the $183 swing high. If not, there are chances of a downside extension towards the $172 level.
Looking at the chart, Ethereum price is clearly facing a strong selling interest above $180 and it is struggling to continue higher, despite positive moves in bitcoin above $10,450. Therefore, it seems like there could be a downside reaction below $175 before the price starts a fresh increase.
ETH Technical Indicators
Hourly MACD – The MACD for ETH/USD is currently gaining momentum in the bearish zone.
Hourly RSI – The RSI for ETH/USD is currently below the 50 level, with a bearish angle.
Major Support Level – $172
Major Resistance Level – $180-$182