

- ETH price climbed higher steadily and broke the $215 resistance area against the US Dollar.
- The price topped near the $220 level and recently corrected below $215.
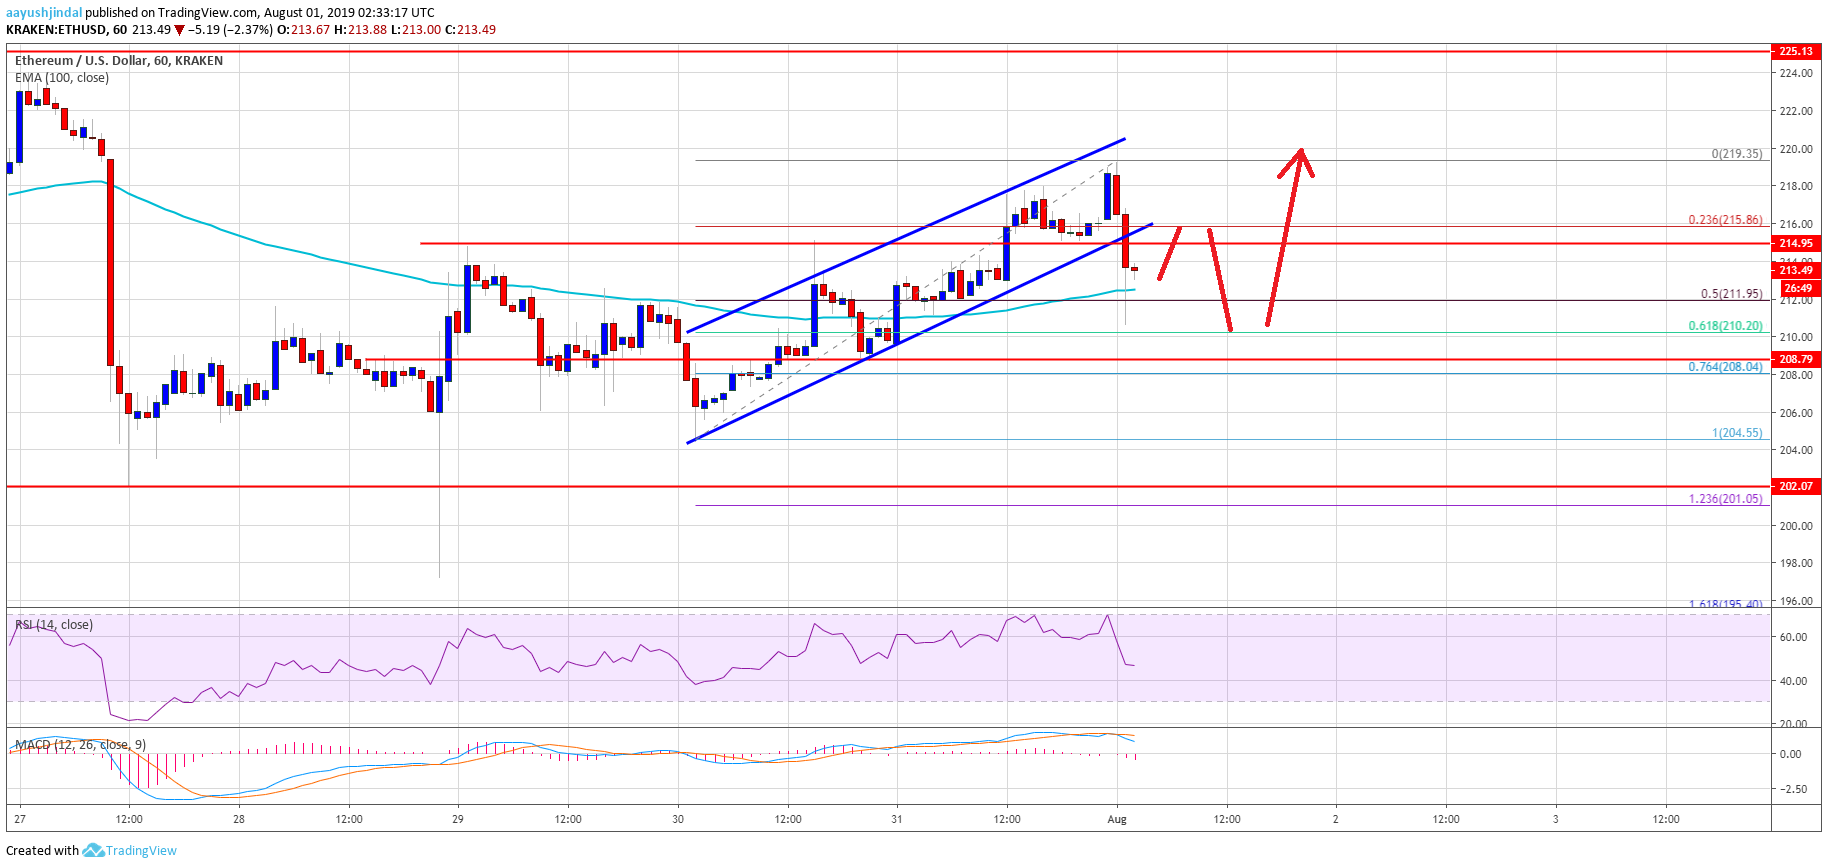
- There was a break below an ascending channel with support at $216 on the hourly chart of ETH/USD (data feed via Kraken).
- The pair remains well bid on the downside near the $210 and $208 support levels.
Ethereum price is struggling to continue higher versus the US Dollar, while bitcoin broke $10,000. ETH price is likely to bounce back as long as it is above the $210 support.
Ethereum Price Analysis
In the past few hours, Ethereum price climbed higher steadily above $210 against the US Dollar. The ETH/USD pair broke the key $215 resistance level to post a new weekly high. Moreover, there was a close above the $210 level and the 100 hourly simple moving average. Finally, the price traded towards the $220 level, where sellers emerged and protected more gains.
More importantly, bitcoin price climbed higher and recently broke the $10,000 resistance level. After topping near the $220 level, ETH price corrected lower. It traded below the $215 support level to move away from the uptrend. Moreover, there was a break below an ascending channel with support at $216 on the hourly chart of ETH/USD. The pair tested the 50% Fib retracement level of the upward leg from the $204 low to $220 high.
However, the decline was protected by the $210 support level and the 100 hourly SMA. Additionally, the 61.8% Fib retracement level of the upward leg from the $204 low to $220 high is also near the $210 level to provide support. Therefore, the $210 level might play an important role in the next move. As long as the price is above the $210 level, there could be a fresh upward move.
On the upside, the $220 level is an immediate resistance. If there is a clear break above the $220 resistance, the price could break the $225 level in the near term. Conversely, if there is a downside break below the $210 support, the price might revisit the $205 support area.
Looking at the chart, Ethereum price is showing positive signs above the $210 level. The price action suggests a fresh increase above the $215 and $218 levels. However, a clear break above the $220 level will most likely open the doors for a solid upward move above $225 and $230.
ETH Technical Indicators
Hourly MACD – The MACD for ETH/USD is slowly moving in the bearish zone.
Hourly RSI – The RSI for ETH/USD is currently below the 50 level, but it could bounce back.
Major Support Level – $210
Major Resistance Level – $220