Key Highlights
- ETH price is currently attempting a recovery against the US Dollar, but finding sellers on the upside.
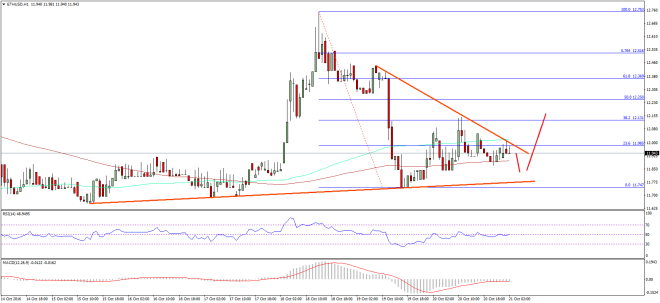
- There is a bearish trend line formed on the hourly chart (data feed via SimpleFX) of ETH/USD, which is currently acting as a resistance.
- The most important hurdle for the buyers on the upside is around the 100 hourly simple moving average.
Ethereum price after a monster decline started a recovery against the US Dollar, but it looks like it won’t be easy for ETH/USD to move higher.
Ethereum Price Resistance
We saw a sharp dip in Ethereum price yesterday against the US Dollar, but somehow the buyers later managed to hold the downside. I highlighted a bullish trend line formed on the hourly chart (data feed via SimpleFX) of ETH/USD yesterday. It continued to act as a support area and pushed the pair higher. The pair even moved once above the 23.6% Fib retracement level of the last leg from the $12.75 high to $11.74 low.
However, there are a couple of hurdles on the upside for the pair, which are protecting a recovery. First, the 100 hourly simple moving average is acting as a barrier. Second, there is a bearish trend line formed on the hourly chart. Third, the 38.2% Fib retracement level of the last leg from the $12.75 high to $11.74 low is acting as a resistance. Considering all these barriers, the ETH buyers are facing a lot of offers, and they are failing to take the price above the $12.00 handle.

However, as long as the support trend line on the downside is intact, there are high chances of the pair attempting another upside break.
Hourly MACD – The MACD is currently attempting to move from the bearish to bullish zone.
Hourly RSI – The RSI is also attempting to move above the 50 level, which is a positive sign.
Major Support Level – $11.80
Major Resistance Level – $12.10
Charts courtesy – SimpleFX