Key Highlights
- Ethereum price continued to dive down against the US Dollar and even broke the $9.50 level.
- There are a couple of bearish trend lines formed on the hourly chart (data feed via Kraken) of ETH/USD, which can be considered as a downside move catalyst.
- There is now a major resistance area forming around $11.00, which may play a crucial role in the short term.
Ethereum price weakened, as the bears did not stop in taking the ETH down against the US Dollar. More losses ahead?
Ethereum Price Resistance
There was no stopping the Eth bears as they took Ethereum price further lower against the US Dollar. A new weekly low was formed at $9.30 where buyers appeared and managed to push the price a few points higher. However, there are now several important resistances on the upside, which may impact the price in the short term.
On the upside, there are a couple of bearish trend lines formed on the hourly chart (data feed via Kraken) of ETH/USD, which may play a crucial role in protecting the upside move. First, there is a minor bearish trend line positioned at $10.80. Second, an upper bearish trend line, the one we followed this whole week. The upper bearish trend line may act as a major hurdle for the bulls in the short term.
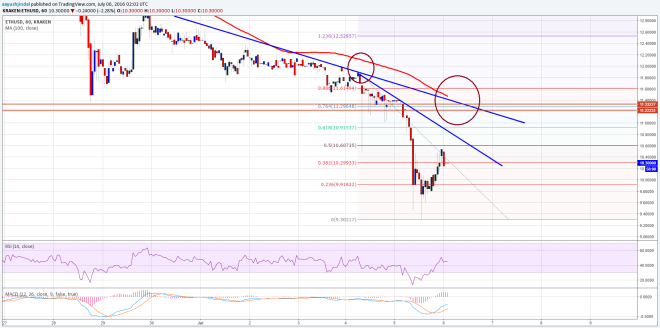

The most important point is that there are a couple of things aligned at $11.20 like the bearish trend line and the 100 hourly simple moving average. So, we can say that the stated level is a major offer zone where the bears might appear if the price attempts to move higher.
Hourly MACD – The MACD has moved into the bullish zone, but may again go into the bearish slope.
Hourly RSI – The RSI managed to bounce from the oversold reading, which is the only positive sign.
Major Support Level – $10.00
Major Resistance Level – $11.20
Charts courtesy of Kraken via Trading View