Key Highlights
- Ethereum price continued to trade in a very tiny range vs the US Dollar, as there was no real move in ETH/USD.
- Yesterday’s highlighted bearish trend line on the hourly chart (data feed via Kraken) of ETH/USD is still intact and acting as a resistance for the buyers.
- On the downside, the 100 hourly simple moving average is acting as a support and preventing losses.
Ethereum price is still in wait and watch mode. No doubt, there is a major break forming on the hourly chart, which traders must consider before trading.
Ethereum Price Break
Ethereum price ETH may be annoying to many traders, as it traded in a tiny range during the past 24 hours vs the US Dollar. There was hardly any major move, and as a result the price was stuck in a range. On the upside, yesterday’s highlighted bearish trend line on the hourly chart (data feed via Kraken) of ETH/USD is acting as a hurdle for the bulls and preventing gains.
Similarly, on the downside, the 100 hourly simple moving average is acting as a barrier for sellers, and stalling losses. In short, the price is stuck between a major resistance area and an important support zone. Even most technical indicators are flat, and pointing towards a consolidating in the short term.
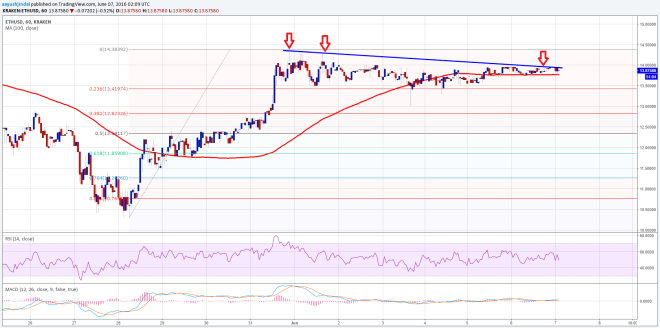

If the price moves below the 100 hourly SMA, then the38.2% Fib retracement level of the last wave from the $10.28 low to $14.38 high may be tested. One may even consider selling in the mentioned scenario with a stop above the trend line and resistance area.
Hourly MACD – The MACD is almost flat, suggesting that the price is ranging before the next move.
Hourly RSI – The RSI just dipped below the 50 level, which can be considered as a negative sign for the bulls.
Intraday Support Level – $13.60
Intraday Resistance Level – $14.00
Charts courtesy of Kraken via Trading View