

Key Highlights
- Ethereum price, after trading a few points above the $11.00 level vs the US Dollar, found sellers and moved down.
- There is a bullish trend line formed on the hourly chart (data feed via Kraken) of ETH/USD, which is currently acting as a support area.
- The price is now below the 100 hourly simple moving average, which is not a good sign for the ETH bulls.
Ethereum price moved below the 100 SMA, but stayed above a support trend line. Can it recover or break the support to move down?
Ethereum Price Trend Line Support
Ethereum price ETH this past week managed to register a high above the $11.00 level vs the US dollar, and then started to move down. The downside move was sharp, as the price settled below the 100 hourly simple moving average. However, after the break, the ETH/USD found support near a bullish trend line formed on the hourly chart (data feed via Kraken).
Currently, it looks like the ETH bulls are finding it hard to hold the trend line support area. If sellers succeed in breaking it, then a move towards the $9.50 level is possible. On the upside, an initial resistance is around the 38.2% Fib retracement level of the last drop from the $11.09 high to $9.74 low. The stated level holds a lot of importance, as the 100 hourly SMA is positioned near it.
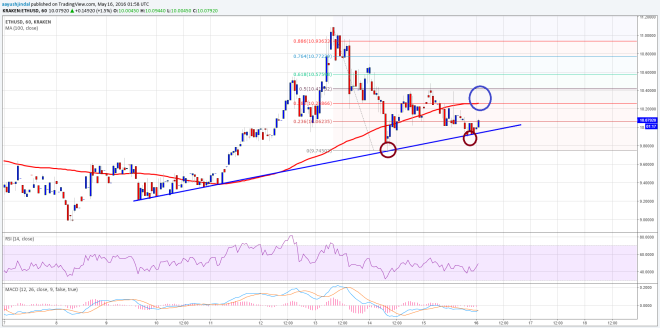

All in all, there is a monster resistance area at $10.25, and as long as the price is below it, there are chances of ETH breaking the trend line support area. One may consider selling with a stop above the $10.25 level.
Hourly MACD – The MACD is in the bearish slope, which is a negative sign.
Hourly RSI – The RSI is below the 50 level, calling for more losses in the short term.
Intraday Support Level – $9.90
Intraday Resistance Level – $10.25
Charts courtesy of Kraken via Trading View
Image via NewsBTC