Key Highlights
- ETH price mostly traded in a range this past couple of weeks against the US Dollar.
- If we have a look at the weekly chart (data feed via SimpleFX) of ETH/USD, there is a broader range formed.
- On the upside, there is a major resistance near $15.00, and on downside $7.00-20 is a support.
Ethereum price looks like forming a monster range on the weekly time frame chart versus the US Dollar, which may stay for some time.
Ethereum Price Range
Ethereum price ETH surprised many traders recently with its ranging moves against the US Dollar. The fact is that there is no major reason for the ETH investors to make big moves. The ETH/USD pair was mostly seen trading in a range, and may continue to do so in the near term. If we have a look at the weekly chart (data feed via SimpleFX) of ETH/USD, then there are a few things to note.
First, there is a broad range formed. On the upside, the $15.00 level is acting as a resistance. On the downside, the $7.20-00 levels are providing support. There are many spikes on both the range high and low. Both are playing their role well and preventing the range to break. On the downside, the range support also coincides with the 61.8% Fib retracement level of the last wave from the $0.005 low to $21.27 high. So, it holds a lot of importance in my opinion.
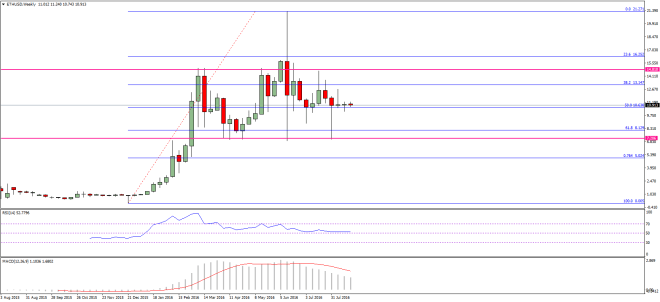

On the upside, the $14.80-15.00 levels are acting as a monster resistance. The ETH bulls failed on many occasions to break it. In my view, we can witness more ranging moves in the short term before the price heads higher.
Weekly MACD – The MACD is placed in the bullish zone, which is a positive sign.
Weekly RSI – The RSI is just above the 50 level, and is almost flat.
Major Range Support Level – $7.20
Major Range Resistance Level – $14.80
Charts courtesy – SimpleFX