Key Highlights
- ETH price finally managed to trade higher against the US Dollar and posted a short-term break.
- Yesterday’s highlighted bearish trend line on the hourly chart (data feed via SimpleFX) of ETH/USD was broken to clear the way for more gains.
- ETH/USD is now above a short-term resistance and may present another buying opportunity.
Ethereum price managed to surpass a bearish trend line versus the US Dollar, which may help ETH buyers to step up the momentum.
Ethereum Price Break
Ethereum price after struggling for a few sessions against the US Dollar finally managed to trade higher. There was a nice upside move, and the price managed to clear a couple of short-term resistances. I highlighted a bearish trend line on the hourly chart (data feed via SimpleFX) of ETH/USD in my last two analysis. It was acting as a resistance for more gains until recently. The buyers managed to break the same and took the price higher.
During the upside move, there was a break above a couple of other hurdles as well. First, the 38.2% Fib retracement level of the last drop from the $13.34 high to $12.53 was cleared. Second, the price also managed to close above the 100 hourly simple moving average. However, the upside was stopped near another major resistance. The 200 hourly SMA was sitting at $13.03 to act as a barrier for the bulls.
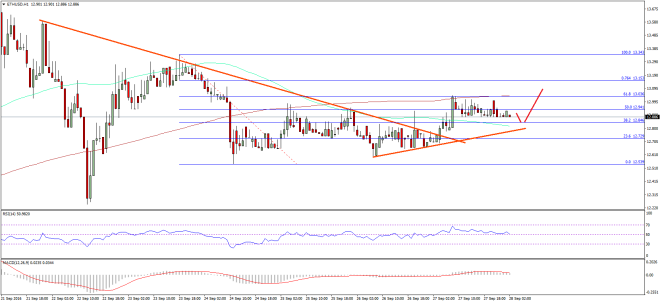

Moreover, the 61.8% Fib retracement level of the last drop from the $13.34 high to $12.53 also prevented gains. The price is currently correcting lower, but remains supported. If there is a move towards the 100 hourly SMA, then the ETH buyers are likely to protect losses. One may consider buying in that situation with a stop below it.
Hourly MACD – The MACD is currently in the bullish zone.
Hourly RSI – The RSI is above the 50 level, and suggesting more gains.
Major Support Level – $12.80
Major Resistance Level – $13.05
Charts courtesy – SimpleFX