Key Highlights
- ETH price started to weaken against the US Dollar, and it looks set for more declines as buyers are losing control.
- Yesterday’s highlighted bearish trend line on the hourly chart (data feed via SimpleFX) of ETH/USD is acting as a resistance.
- The double top pattern formed yesterday is playing well in pushing the price down.
Ethereum price ETH started correcting lower against the US Dollar. Now we need to see how low it can go before gaining traction once again.
Ethereum Price Decline
Ethereum price ETH climbed higher this week to trade as high as $12.66 where it found sellers and moved down. There was a bearish trend line formed on the hourly chart (data feed via SimpleFX) of ETH/USD, as highlighted yesterday. It is acting as a resistance for the buyers and pushing the price down. Recently, the price also moved below the 100 hourly simple moving average, which is a bearish sign.
No doubt, the price is currently under a bearish pressure, and may move down further. It already broke the 50% Fib retracement level of the last leg from the $10.85 low to $12.66 high. It means there is a possibility of it testing even the last swing low.
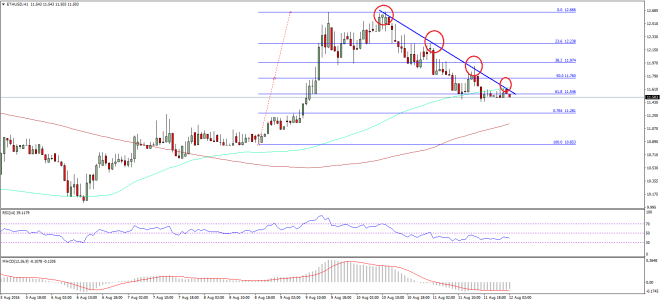

In my opinion, the price can test the 76.4% Fib retracement level of the last leg from the $10.85 low to $12.66 high, which is at $11.28. Any further declines may depend on the market sentiment. I believe this is a correction, and once it is complete the price may bounce back. We need to keep tracking the highlighted bearish trend line on the hourly chart, as it may play a crucial role moving ahead.
Hourly MACD – The MACD is currently in the bearish zone, and showing no signs of a changing slope.
Hourly RSI – The RSI is well below the 50 level, which is a bearish sign.
Major Support Level – $11.28
Major Resistance Level – $11.80
Charts courtesy – SimpleFX