Key Highlights
- Ethereum price traded higher vs the US Dollar, and my call of buying dips worked perfectly.
- Now, there is a bullish trend line formed on the hourly chart (data feed via Kraken) of ETH/USD, which can serve as a support area moving ahead.
- There is a chance of ETH testing $15.00 in the short term if the current momentum stays intact.
Ethereum price spiked higher and broke the $14.00 resistance area vs the US dollar. Can we continue to witness gain in ETH?
Ethereum Price – Trend Line Support
Ethereum price ETH after a minor correction yesterday towards the $12.30 support area vs the US Dollar found buyers, and started to trade higher once again. The upside move was crisp and sharp, which resulted in a break of the $14.00 resistance area. The price is currently trading above the stated level, which is a positive sign for the ETH bulls in the near term.
There is now a bullish trend line formed on the hourly chart (data feed via Kraken) of ETH/USD, which may act as a buying zone if the price moves down from the current levels. An initial support on the downside is around the 23.6% Fib retracement level of the last wave from the $10.30 low to $14.38 high. However, the most important support area is around the trend line, as the 38.2% Fib retracement level of the same wave is also positioned near it.
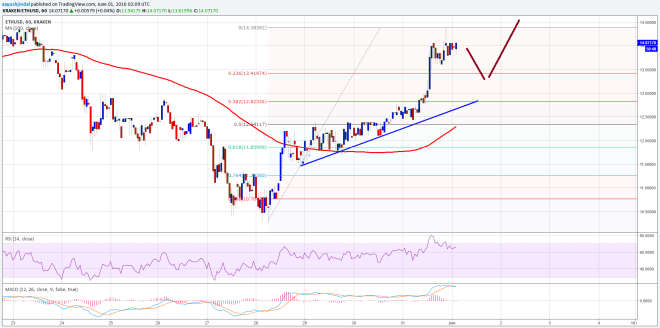

On the upside, I think there is a high chance of a move towards the $15.00 level, which represents a monster barrier for the ETH bulls as it acted as a resistance on many occasions.
Hourly MACD – The MACD is in the bearish zone, which means there is a chance of a minor correction.
Hourly RSI – The RSI is above the 50 level, which is a positive sign for the ETH buyers.
Intraday Support Level – $13.40
Intraday Resistance Level – $14.40
Charts courtesy of Kraken via Trading View