

Key Highlights
- Ethereum price continued to trade higher vs the US Dollar, and traded above the $12.00 level.
- Yesterday, I suggested buying dips may be a good deal, and it looks like it played well as the price moved higher.
- There is a now a bullish trend line formed on the hourly chart (data feed via Kraken) of ETH/USD, which may act as a pivot area in the short term.
Ethereum price surged above the $12.00 level, and it looks like ETH/USD bulls gained a lot of momentum. Can they continue to push prices higher?
Ethereum Price Trend Line as Pivot Area
Ethereum price ETH surprised many traders, as there was almost no correction vs the US Dollar as well as Bitcoin, and the price continued to trade higher. There was a nasty upside ride, as ETH broke a couple of major resistance areas easily and even traded above the $12.00 level. Now, the most important question here is whether the price can continue to move higher or will it correct lower and move down?
The answer can be a bullish trend line formed on the hourly chart (data feed via Kraken) of ETH/USD. The highlighted trend line and support area hold a lot of importance, and it is most likely that the price may bounce one more time if ETH/USD tests it. On the other hand, if the ETH sellers manage to break the trend line, then a move towards the 38.2% Fib retracement level of the last wave from the $10.00 low to $12.70 high is possible.
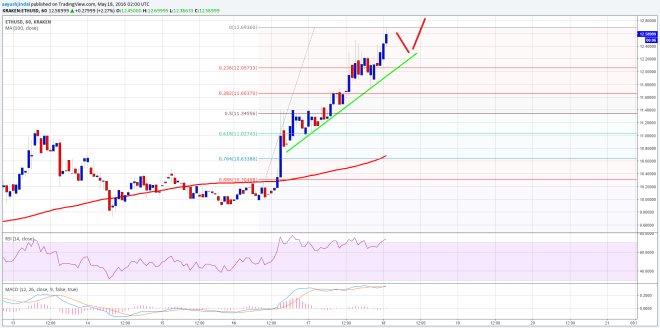

The price is now way above the 100 hourly simple moving average, which is a bit awkward, and could ignite a minor correction. However, you consider buying as long as the price is above the trend line support area.
Hourly MACD – The MACD is strangely showing no action, which is a sign of convergence and a warning.
Hourly RSI – The RSI is around the overbought levels, calling for a minor correction.
Intraday Support Level – $12.00
Intraday Resistance Level – $12.70
Charts courtesy of Kraken via Trading View
Image Courtesy of NewsBTC